
Company
Service


Quality control

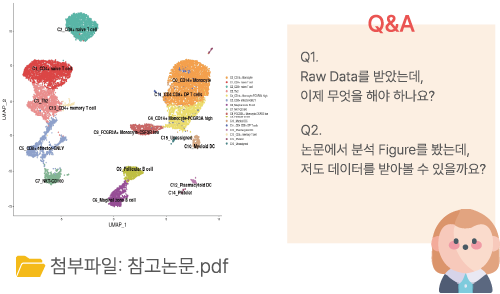
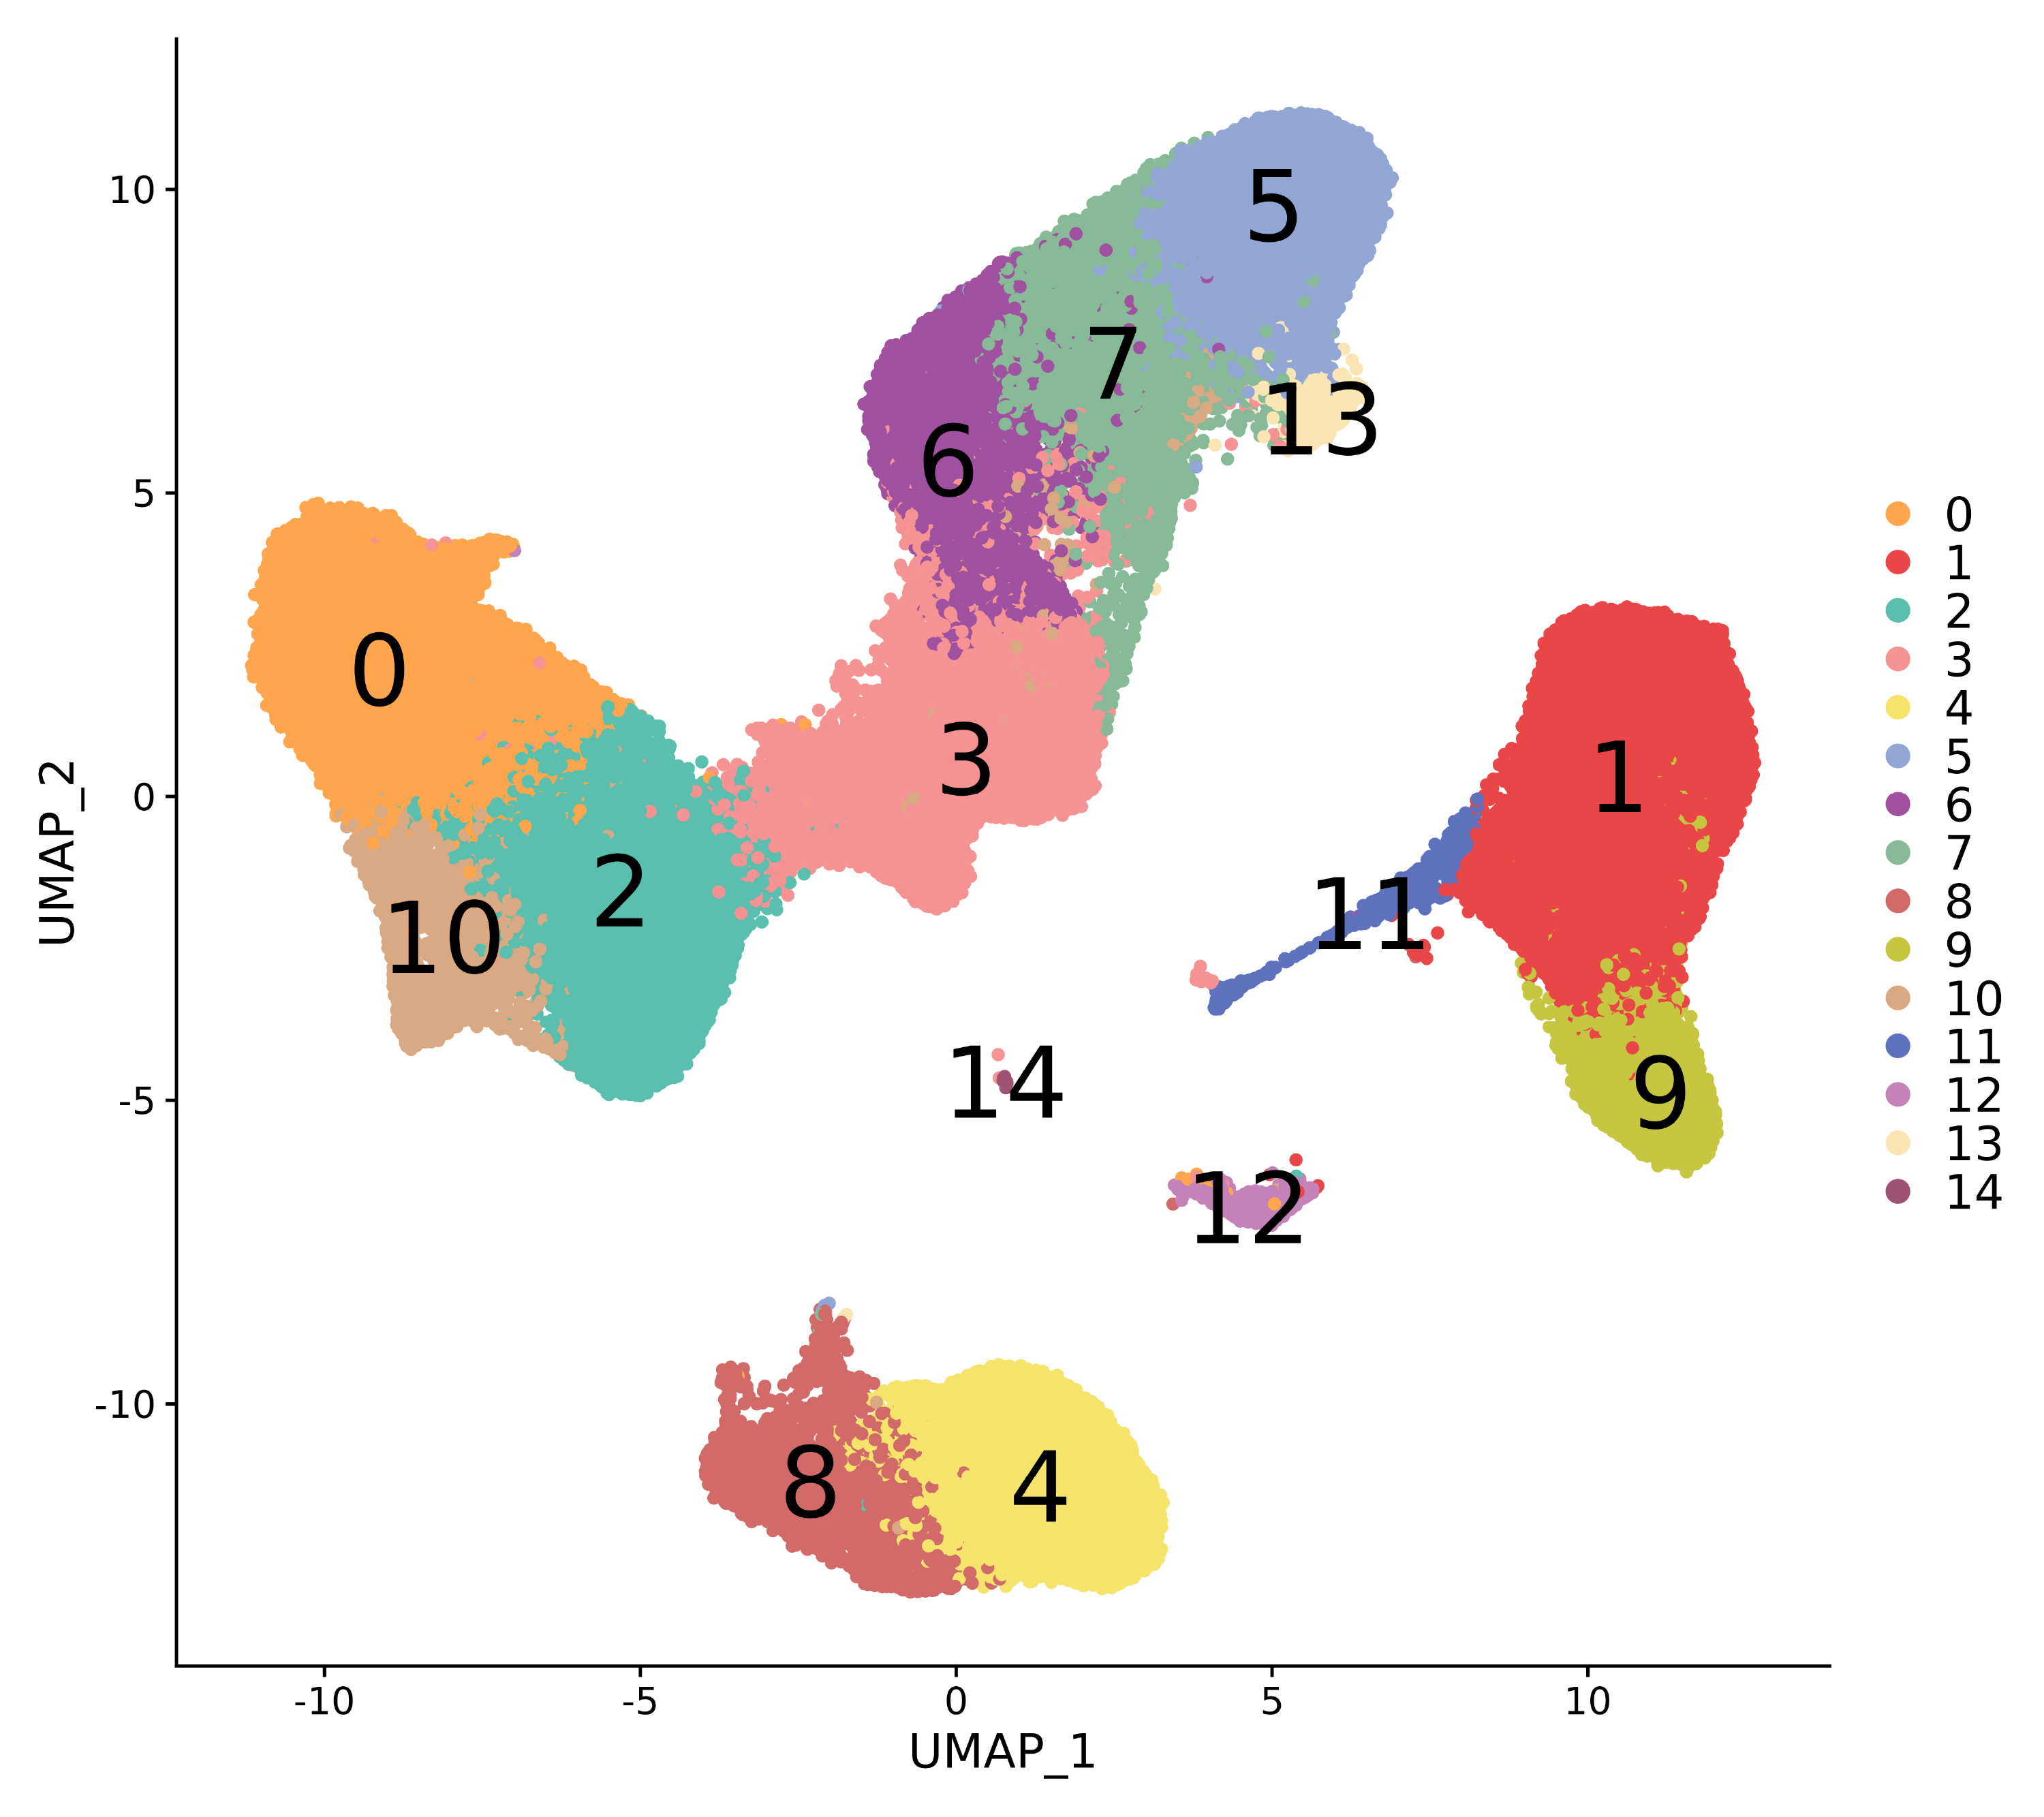
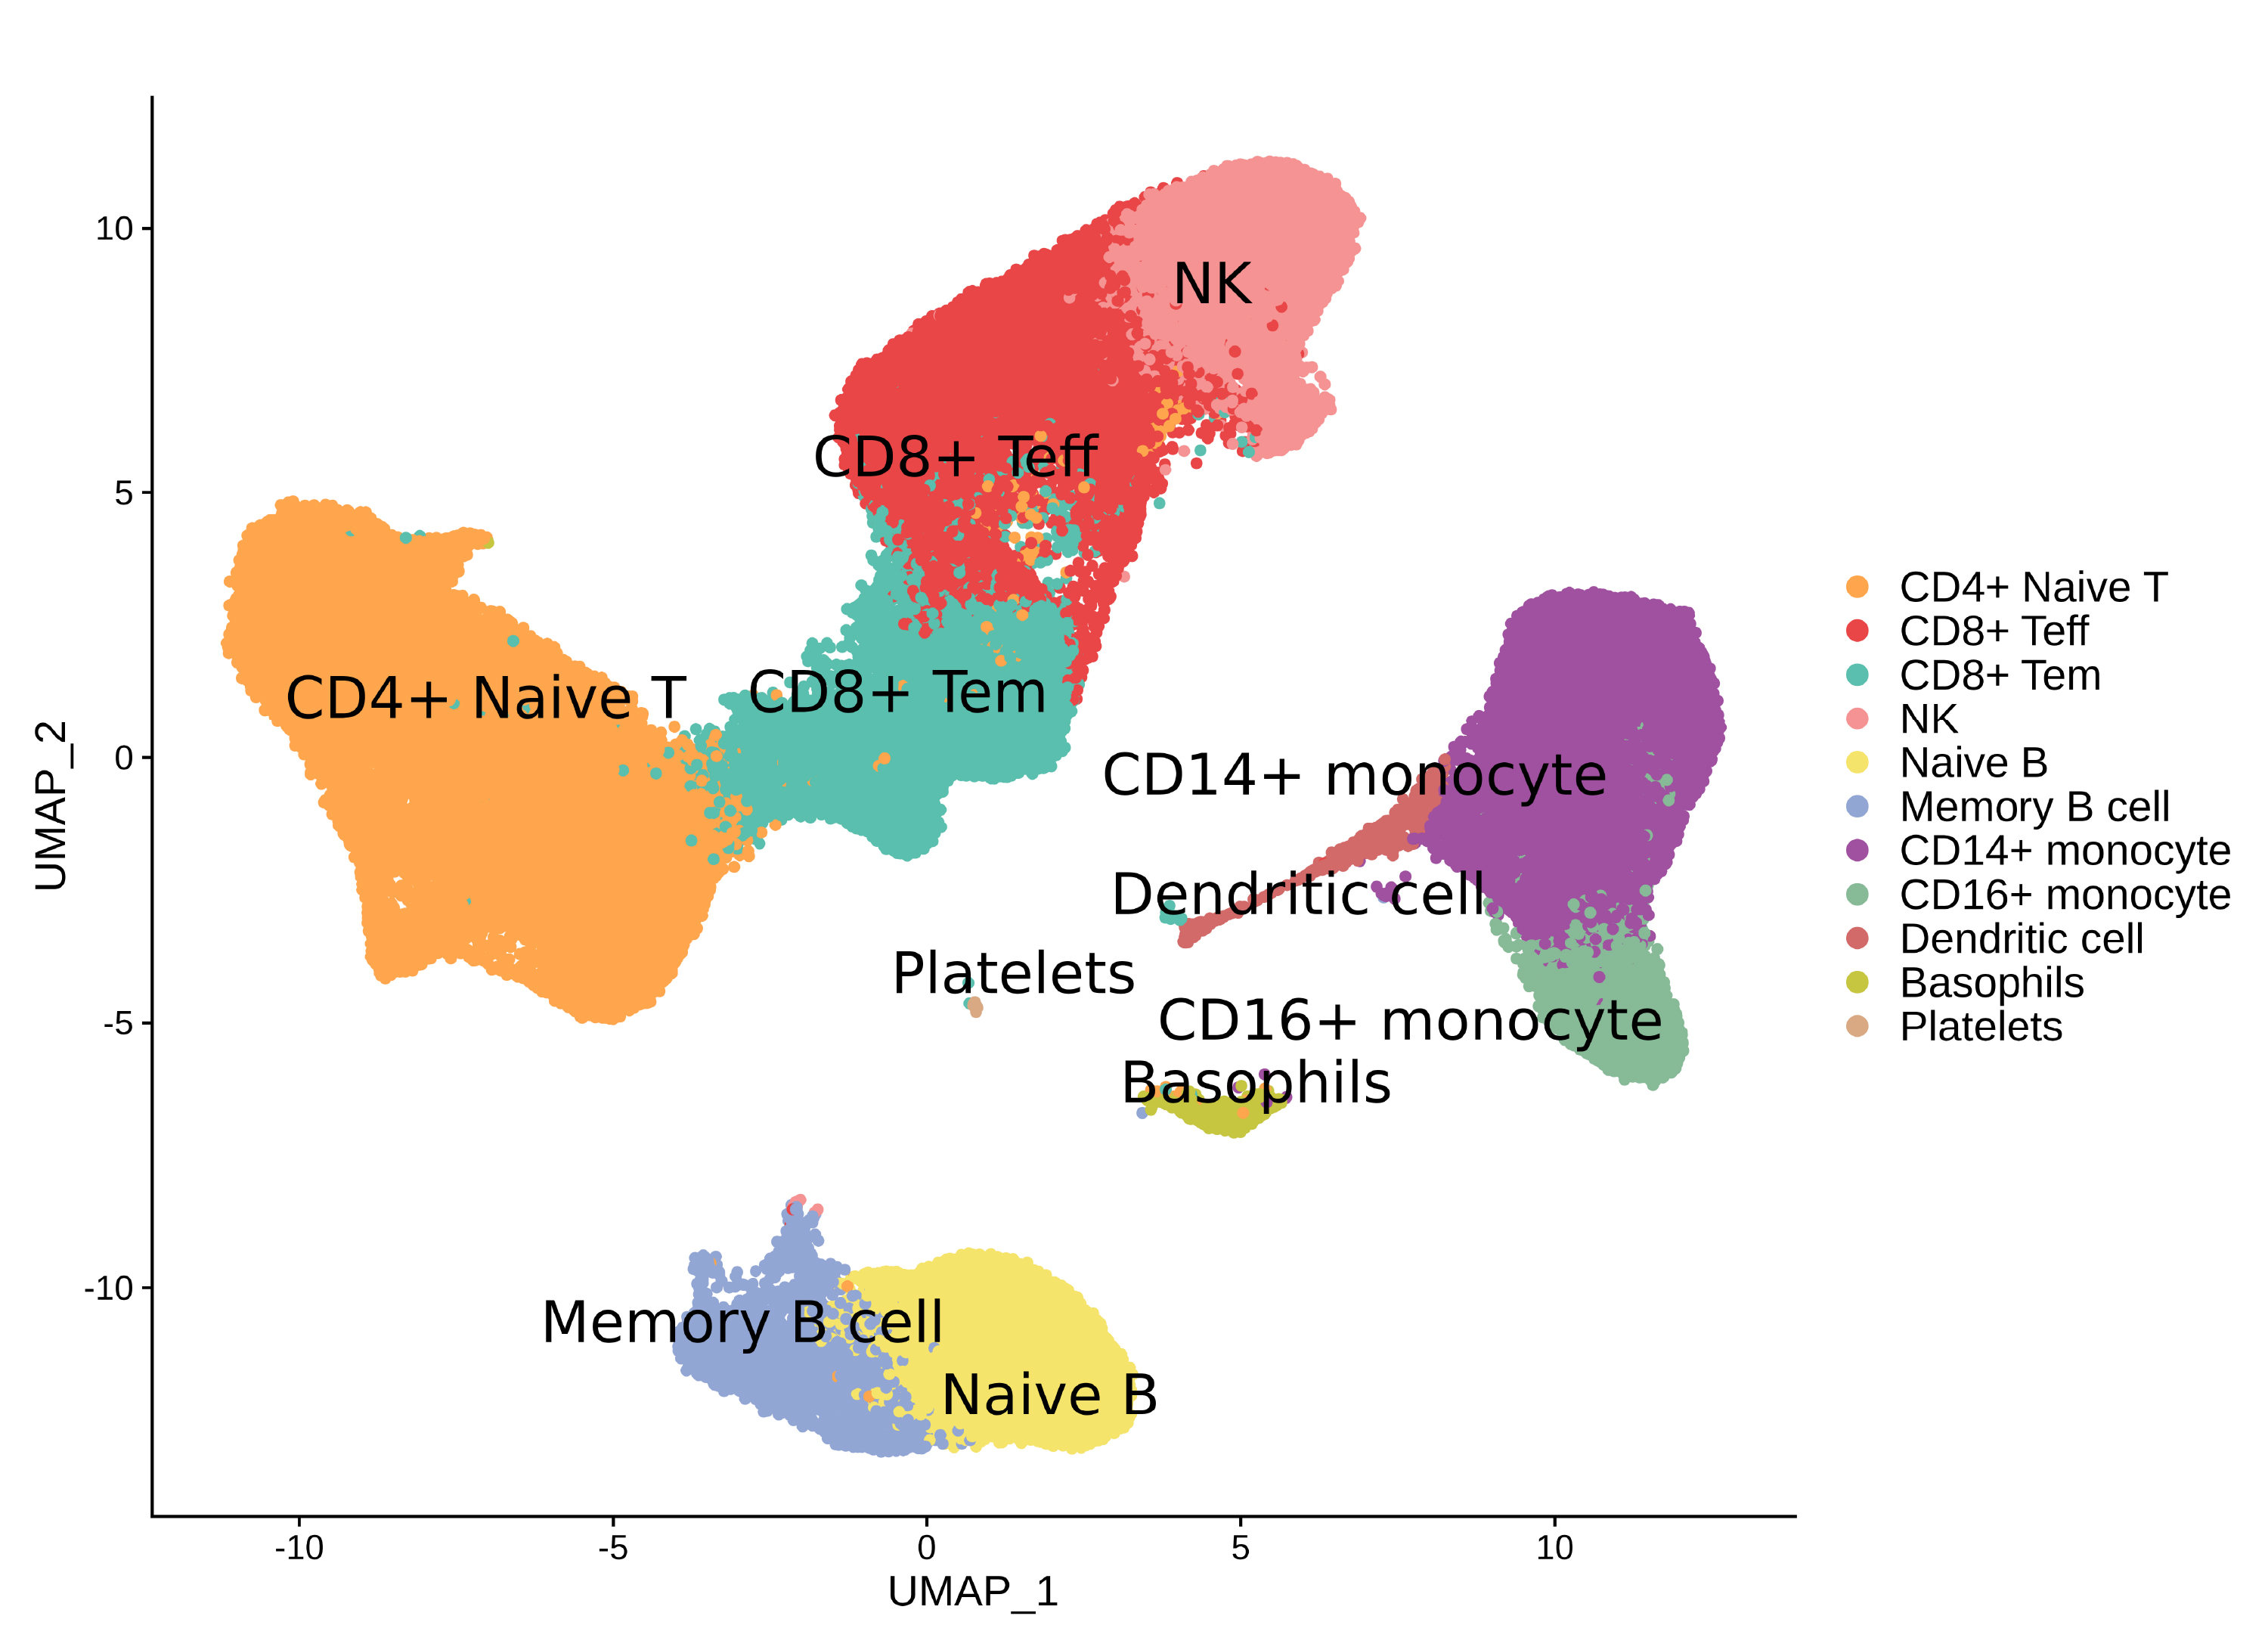
Clustering (UMAP plot)
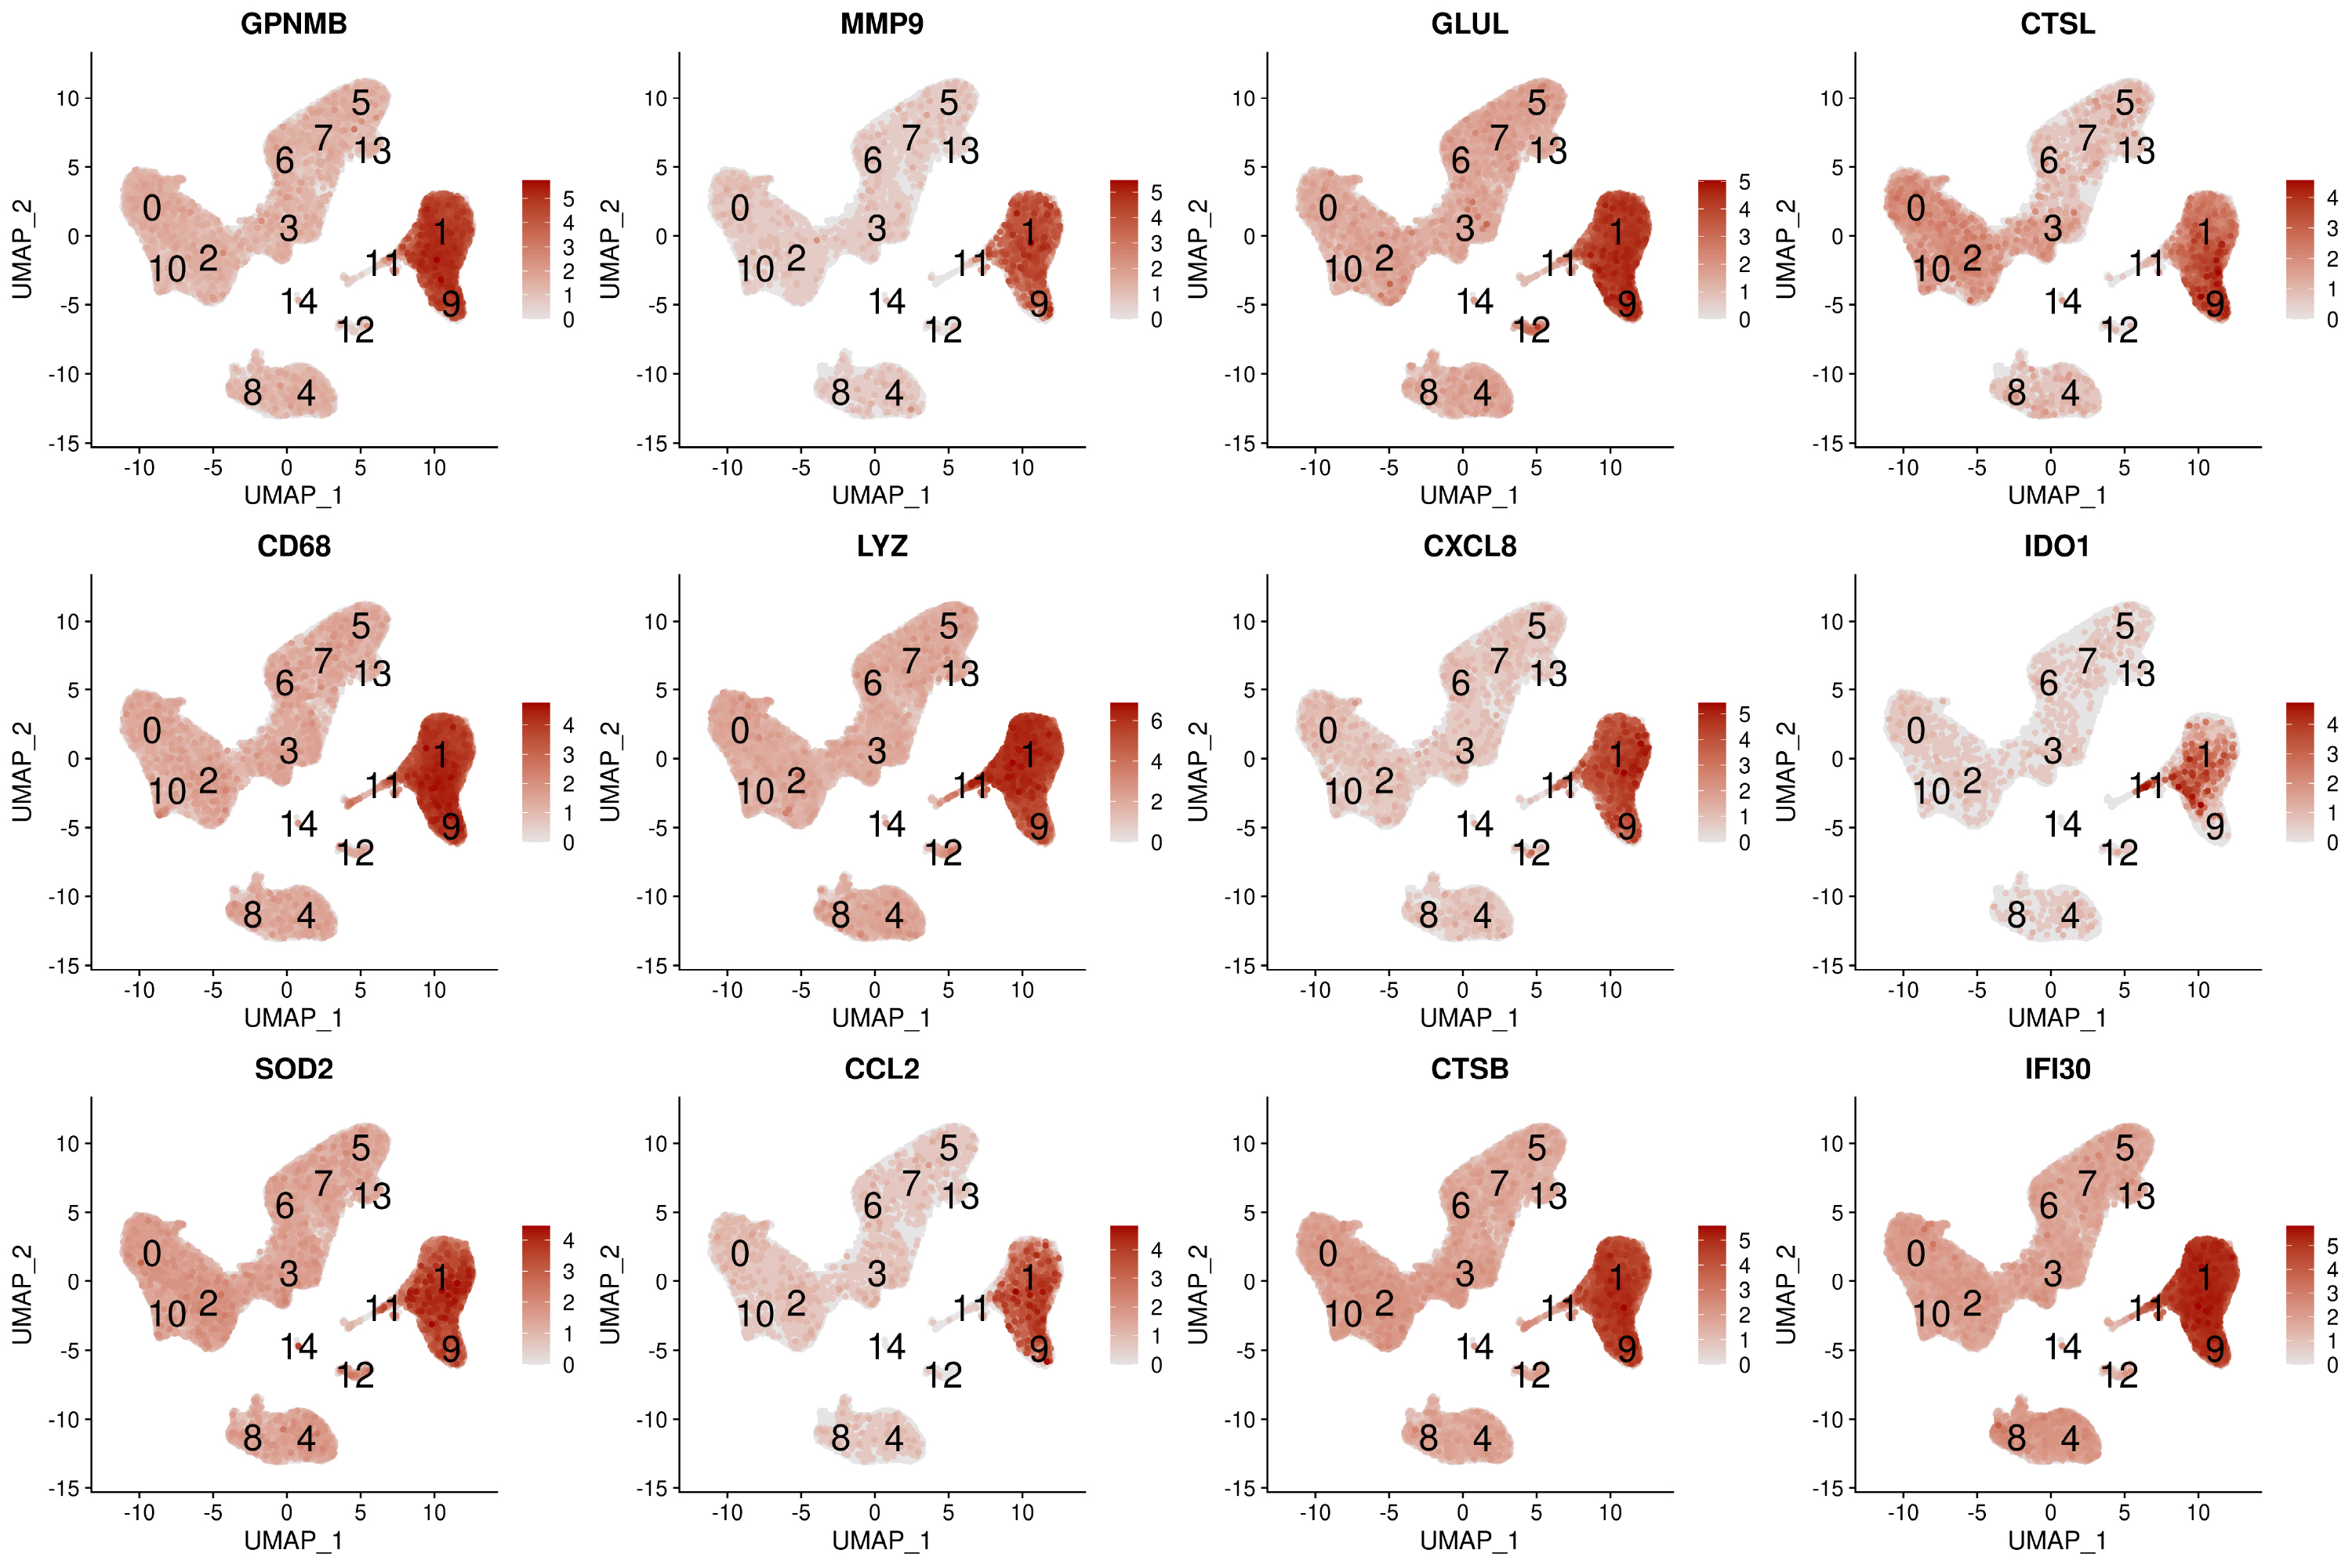
Feature plot
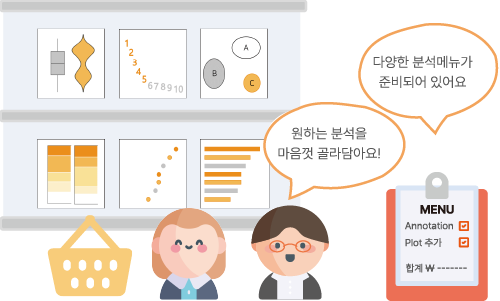
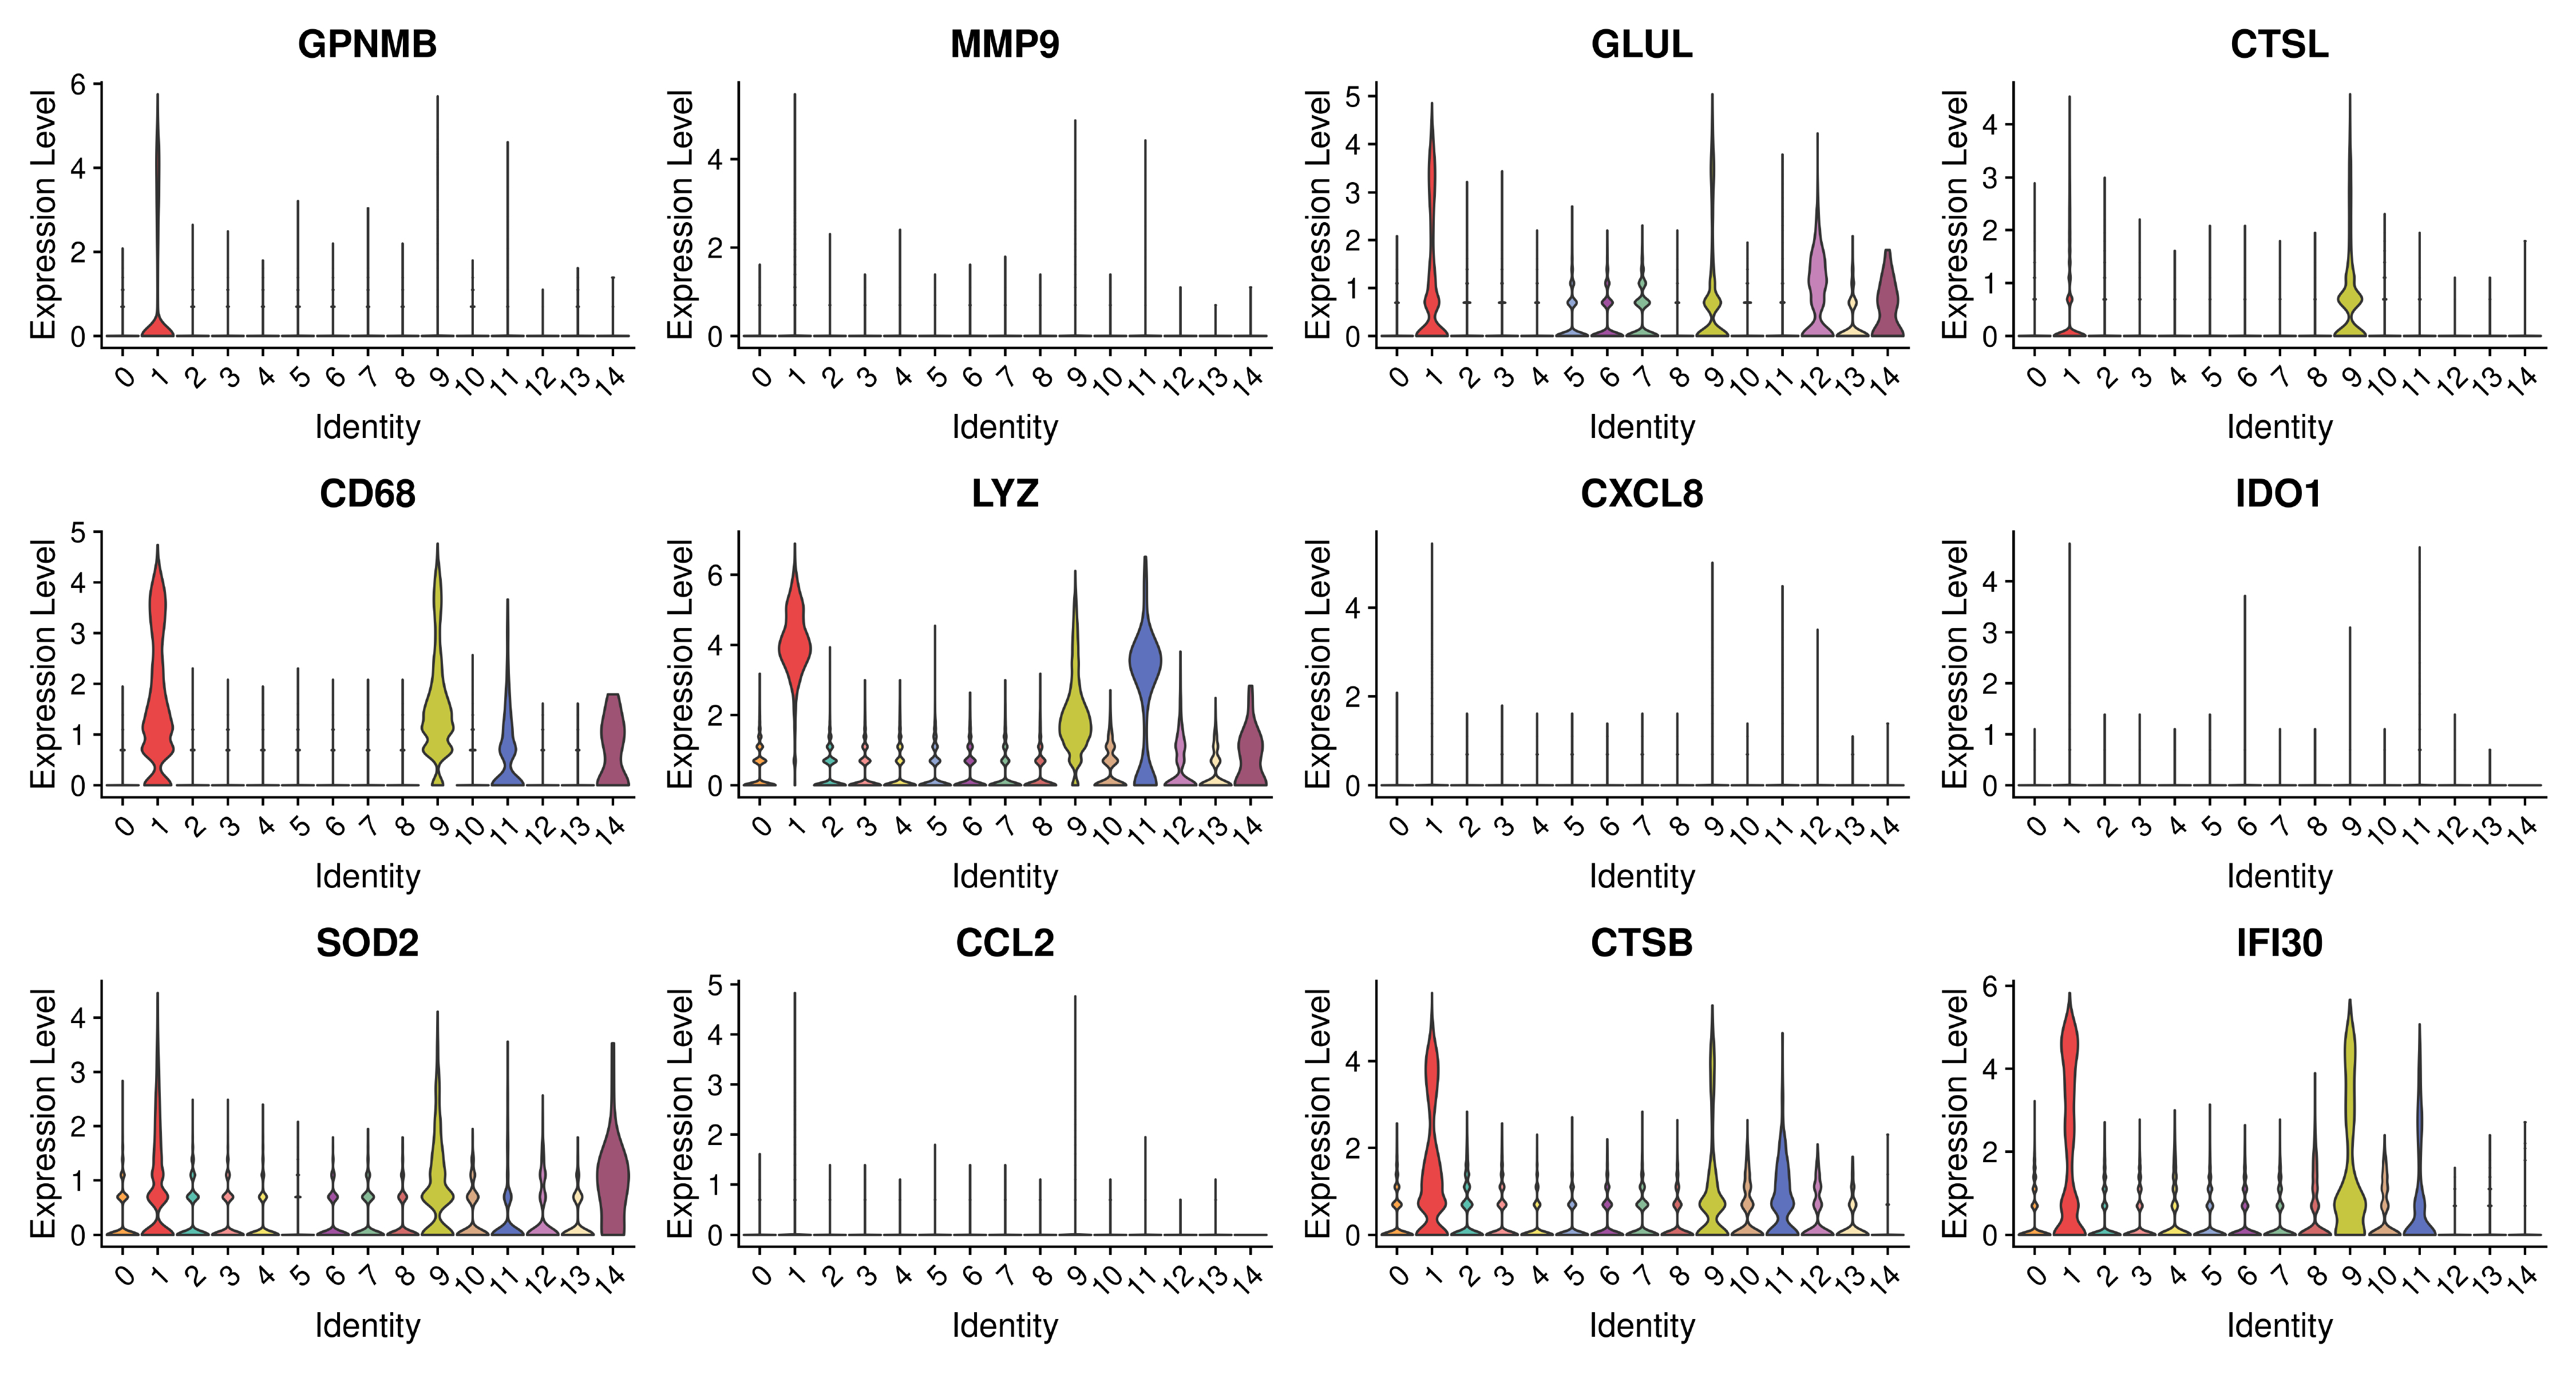
Violin plot
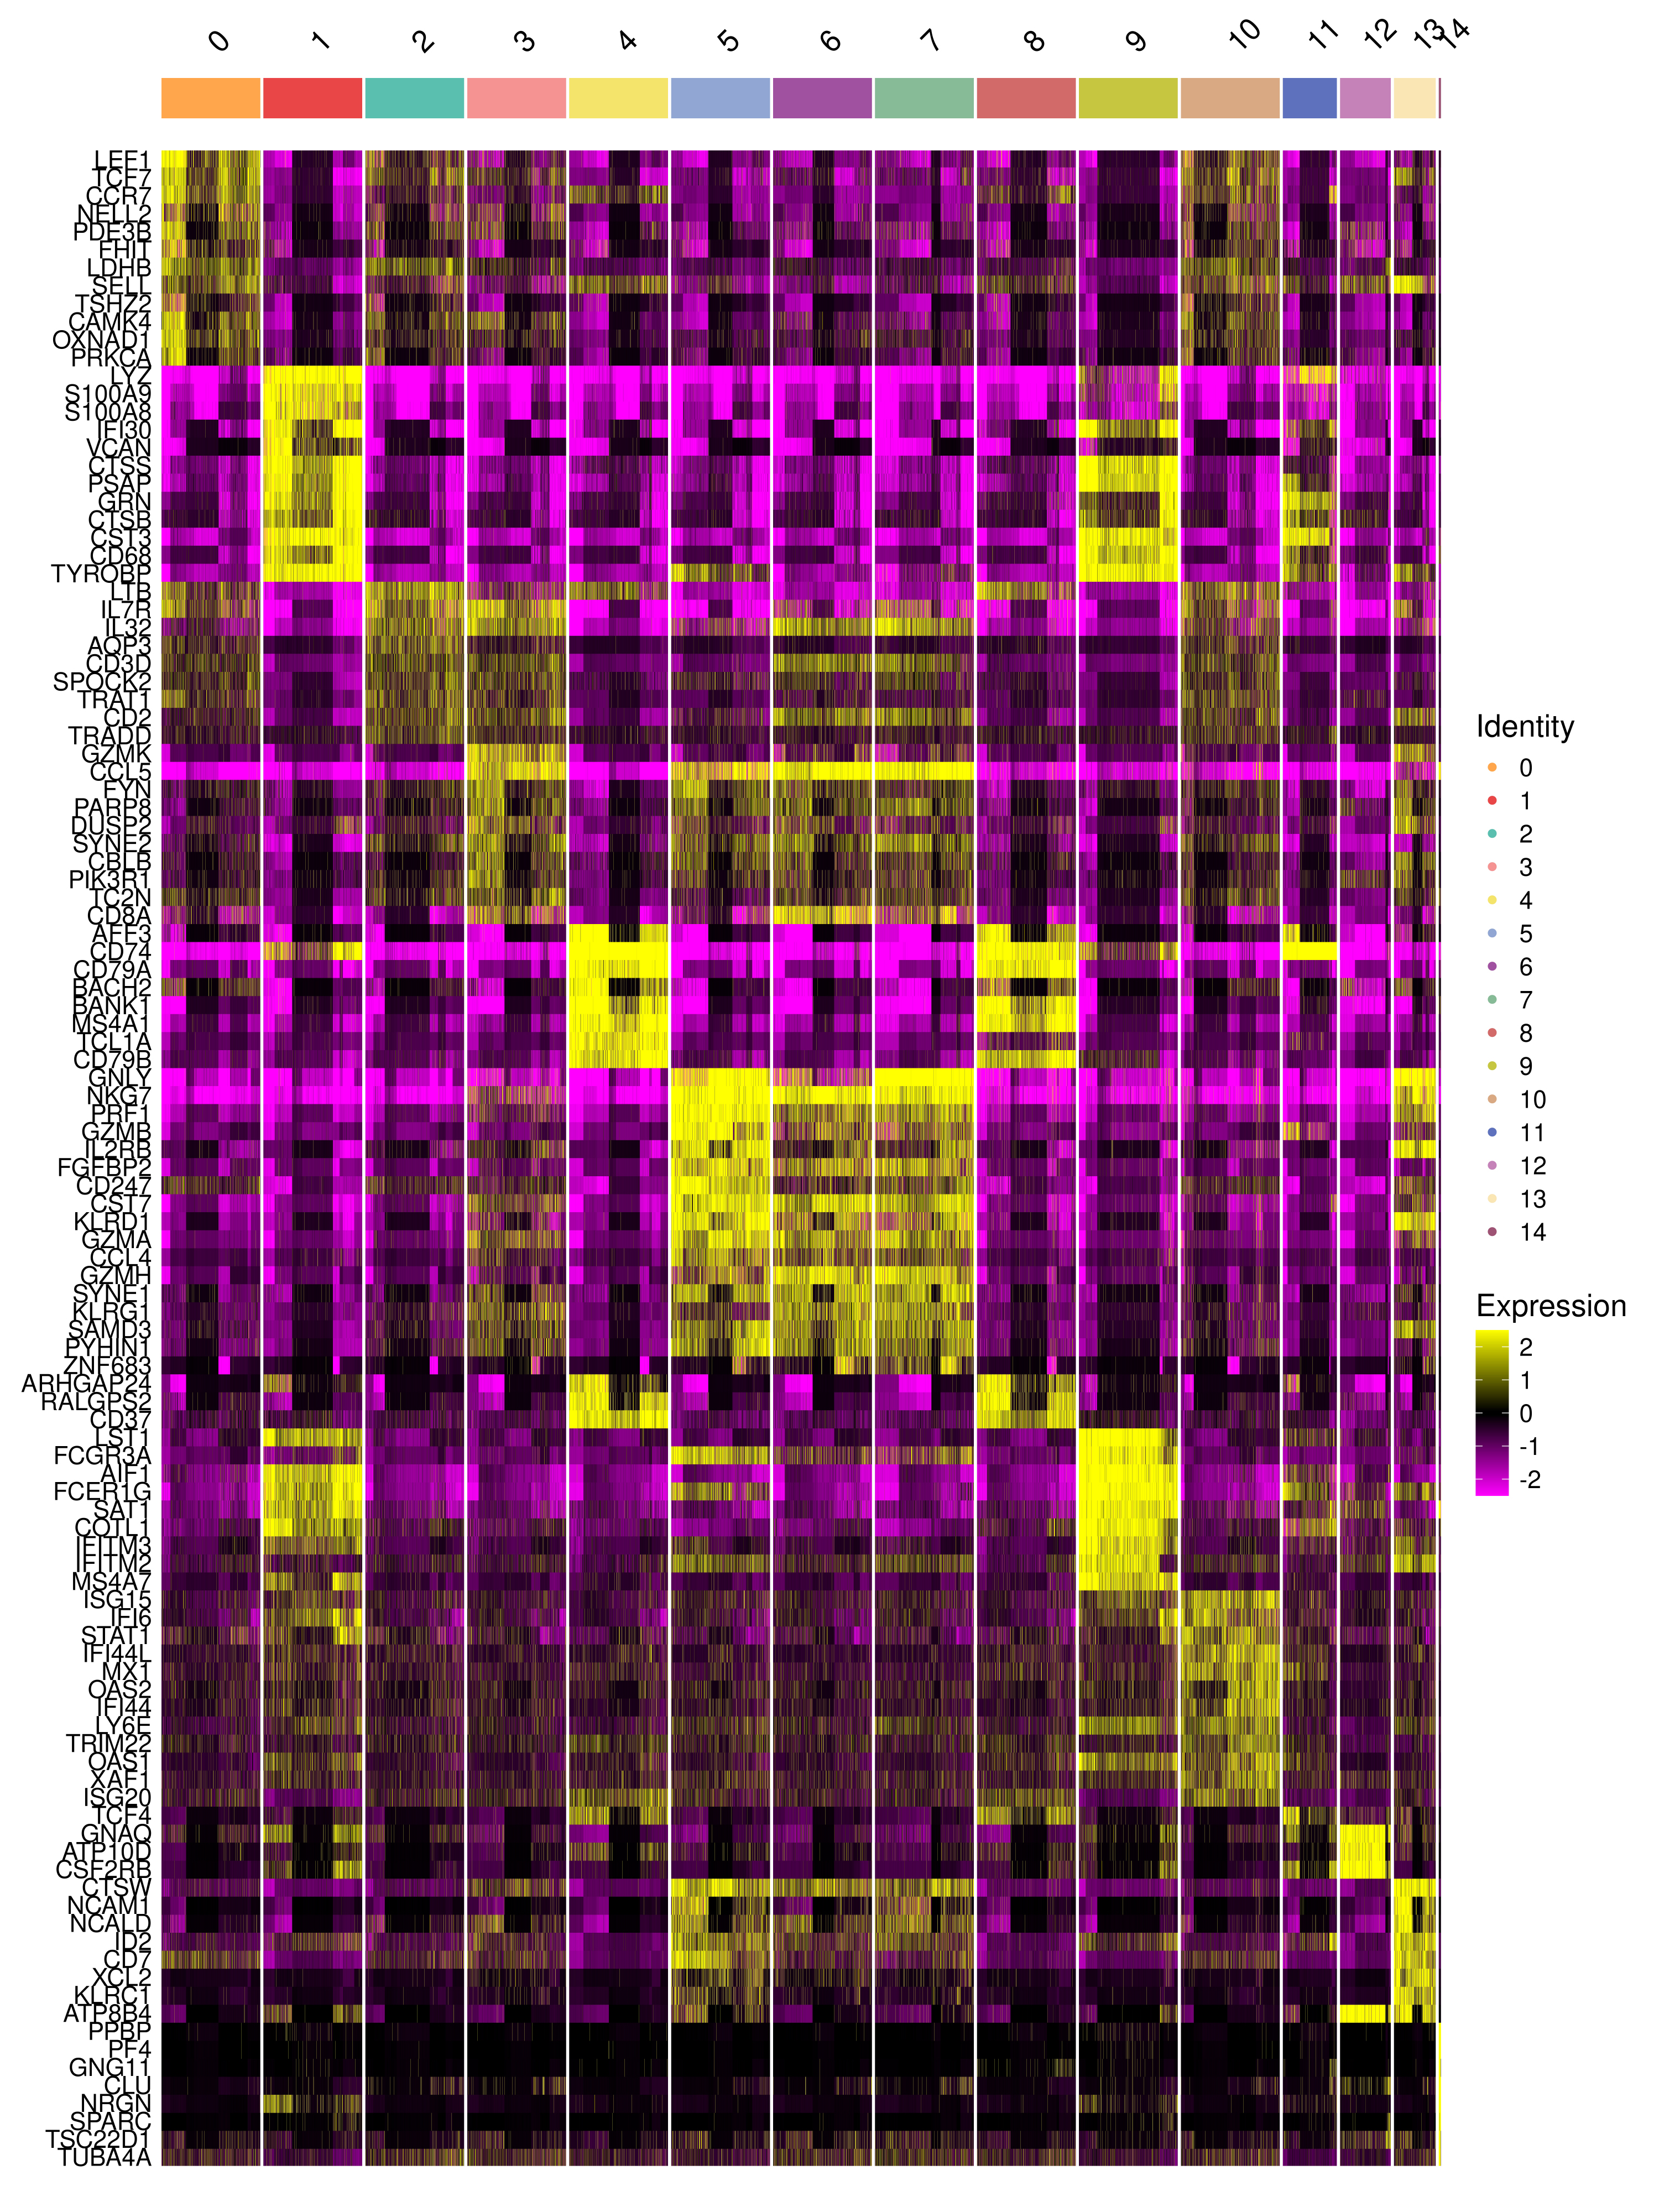
Heatmap
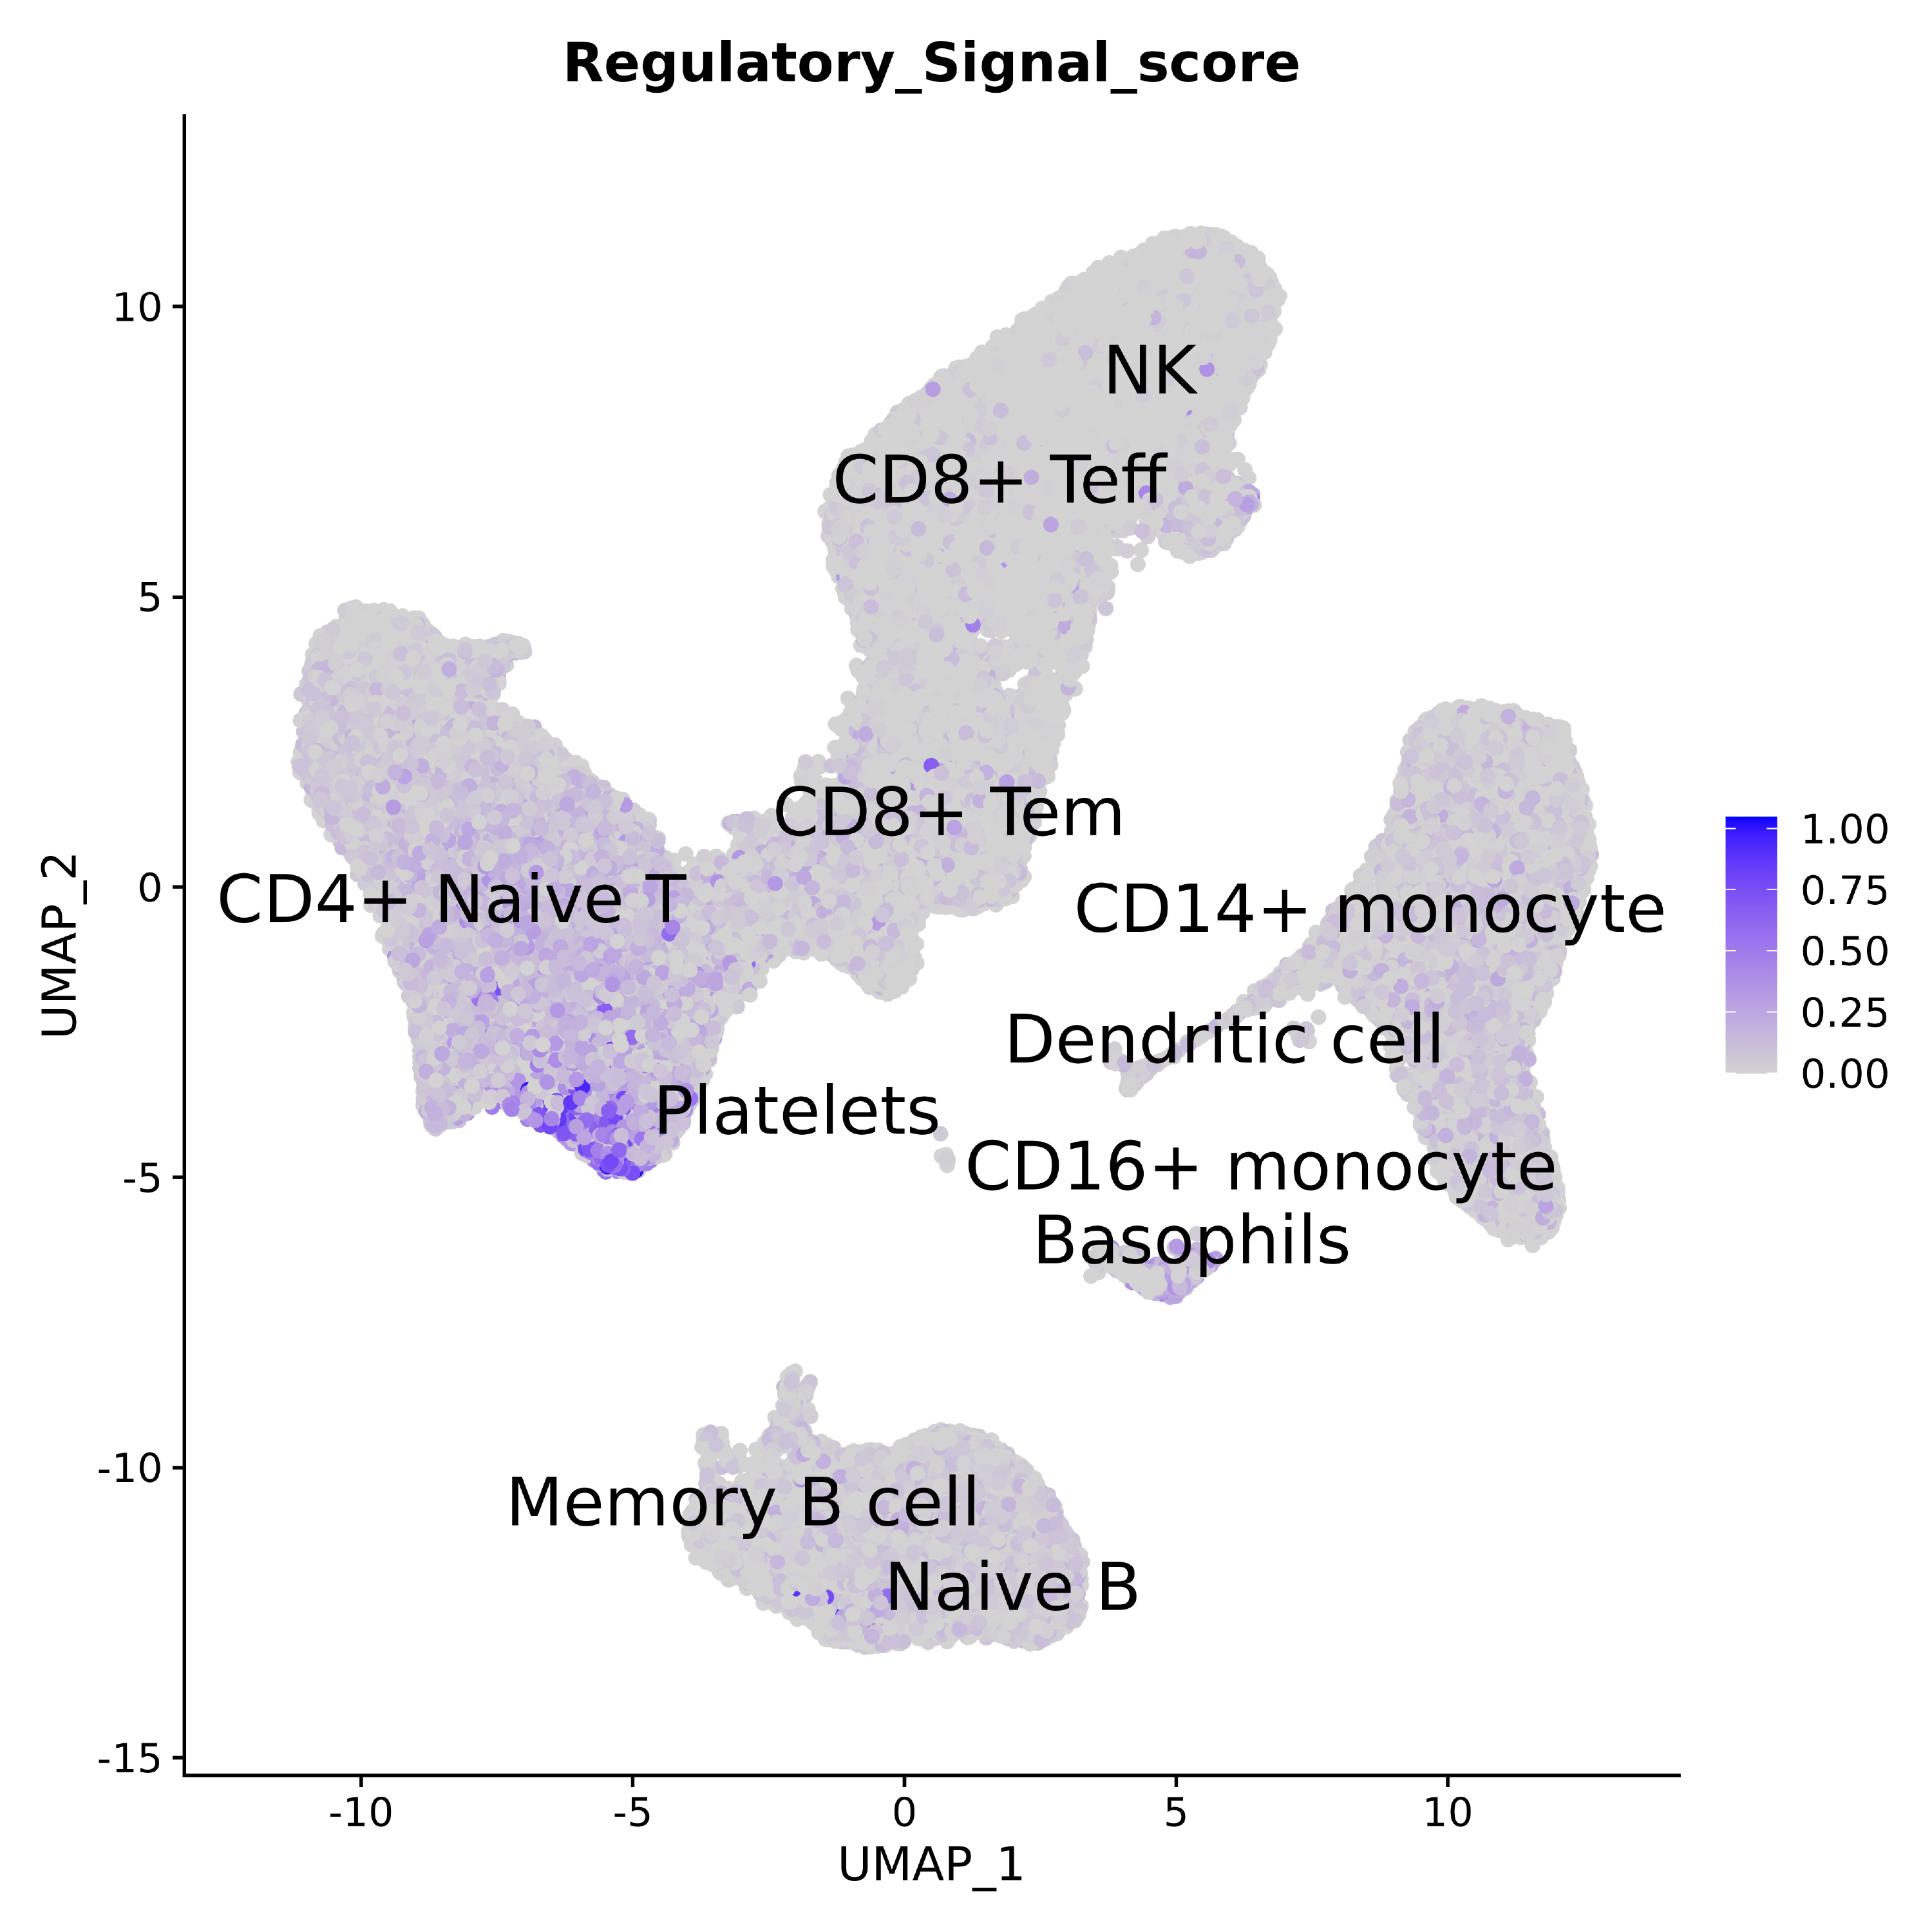
Cell type annotation
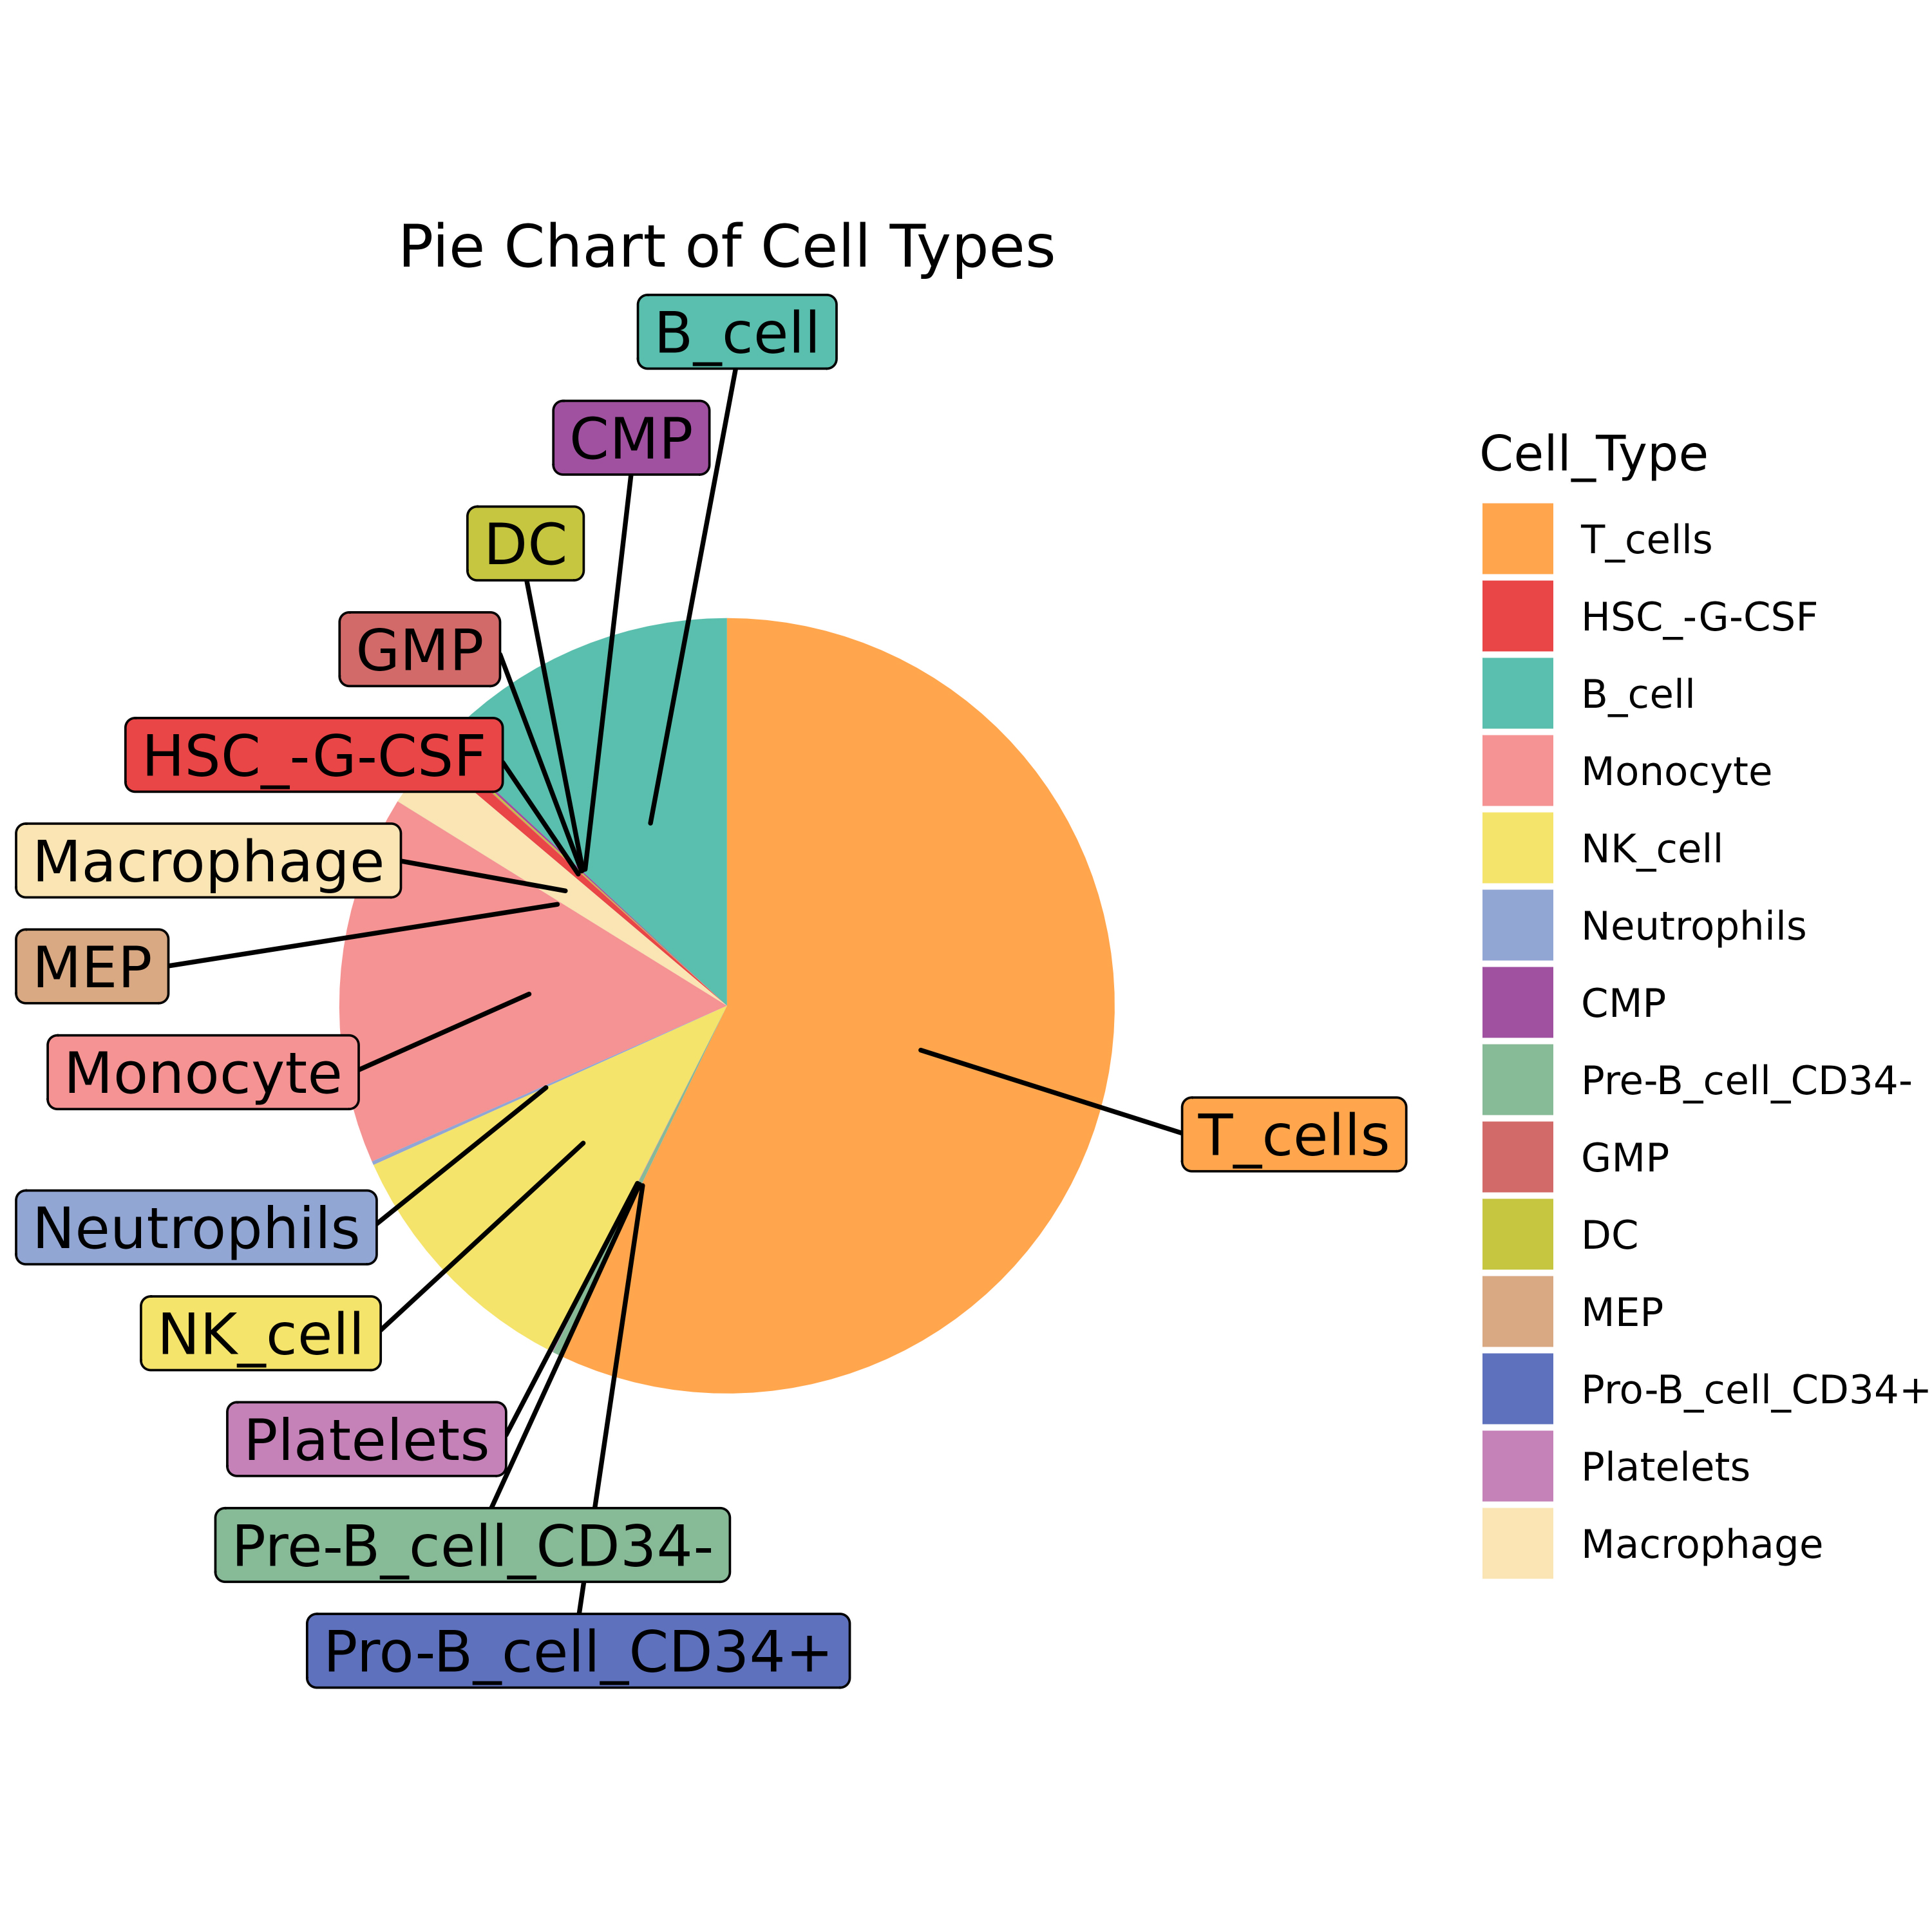
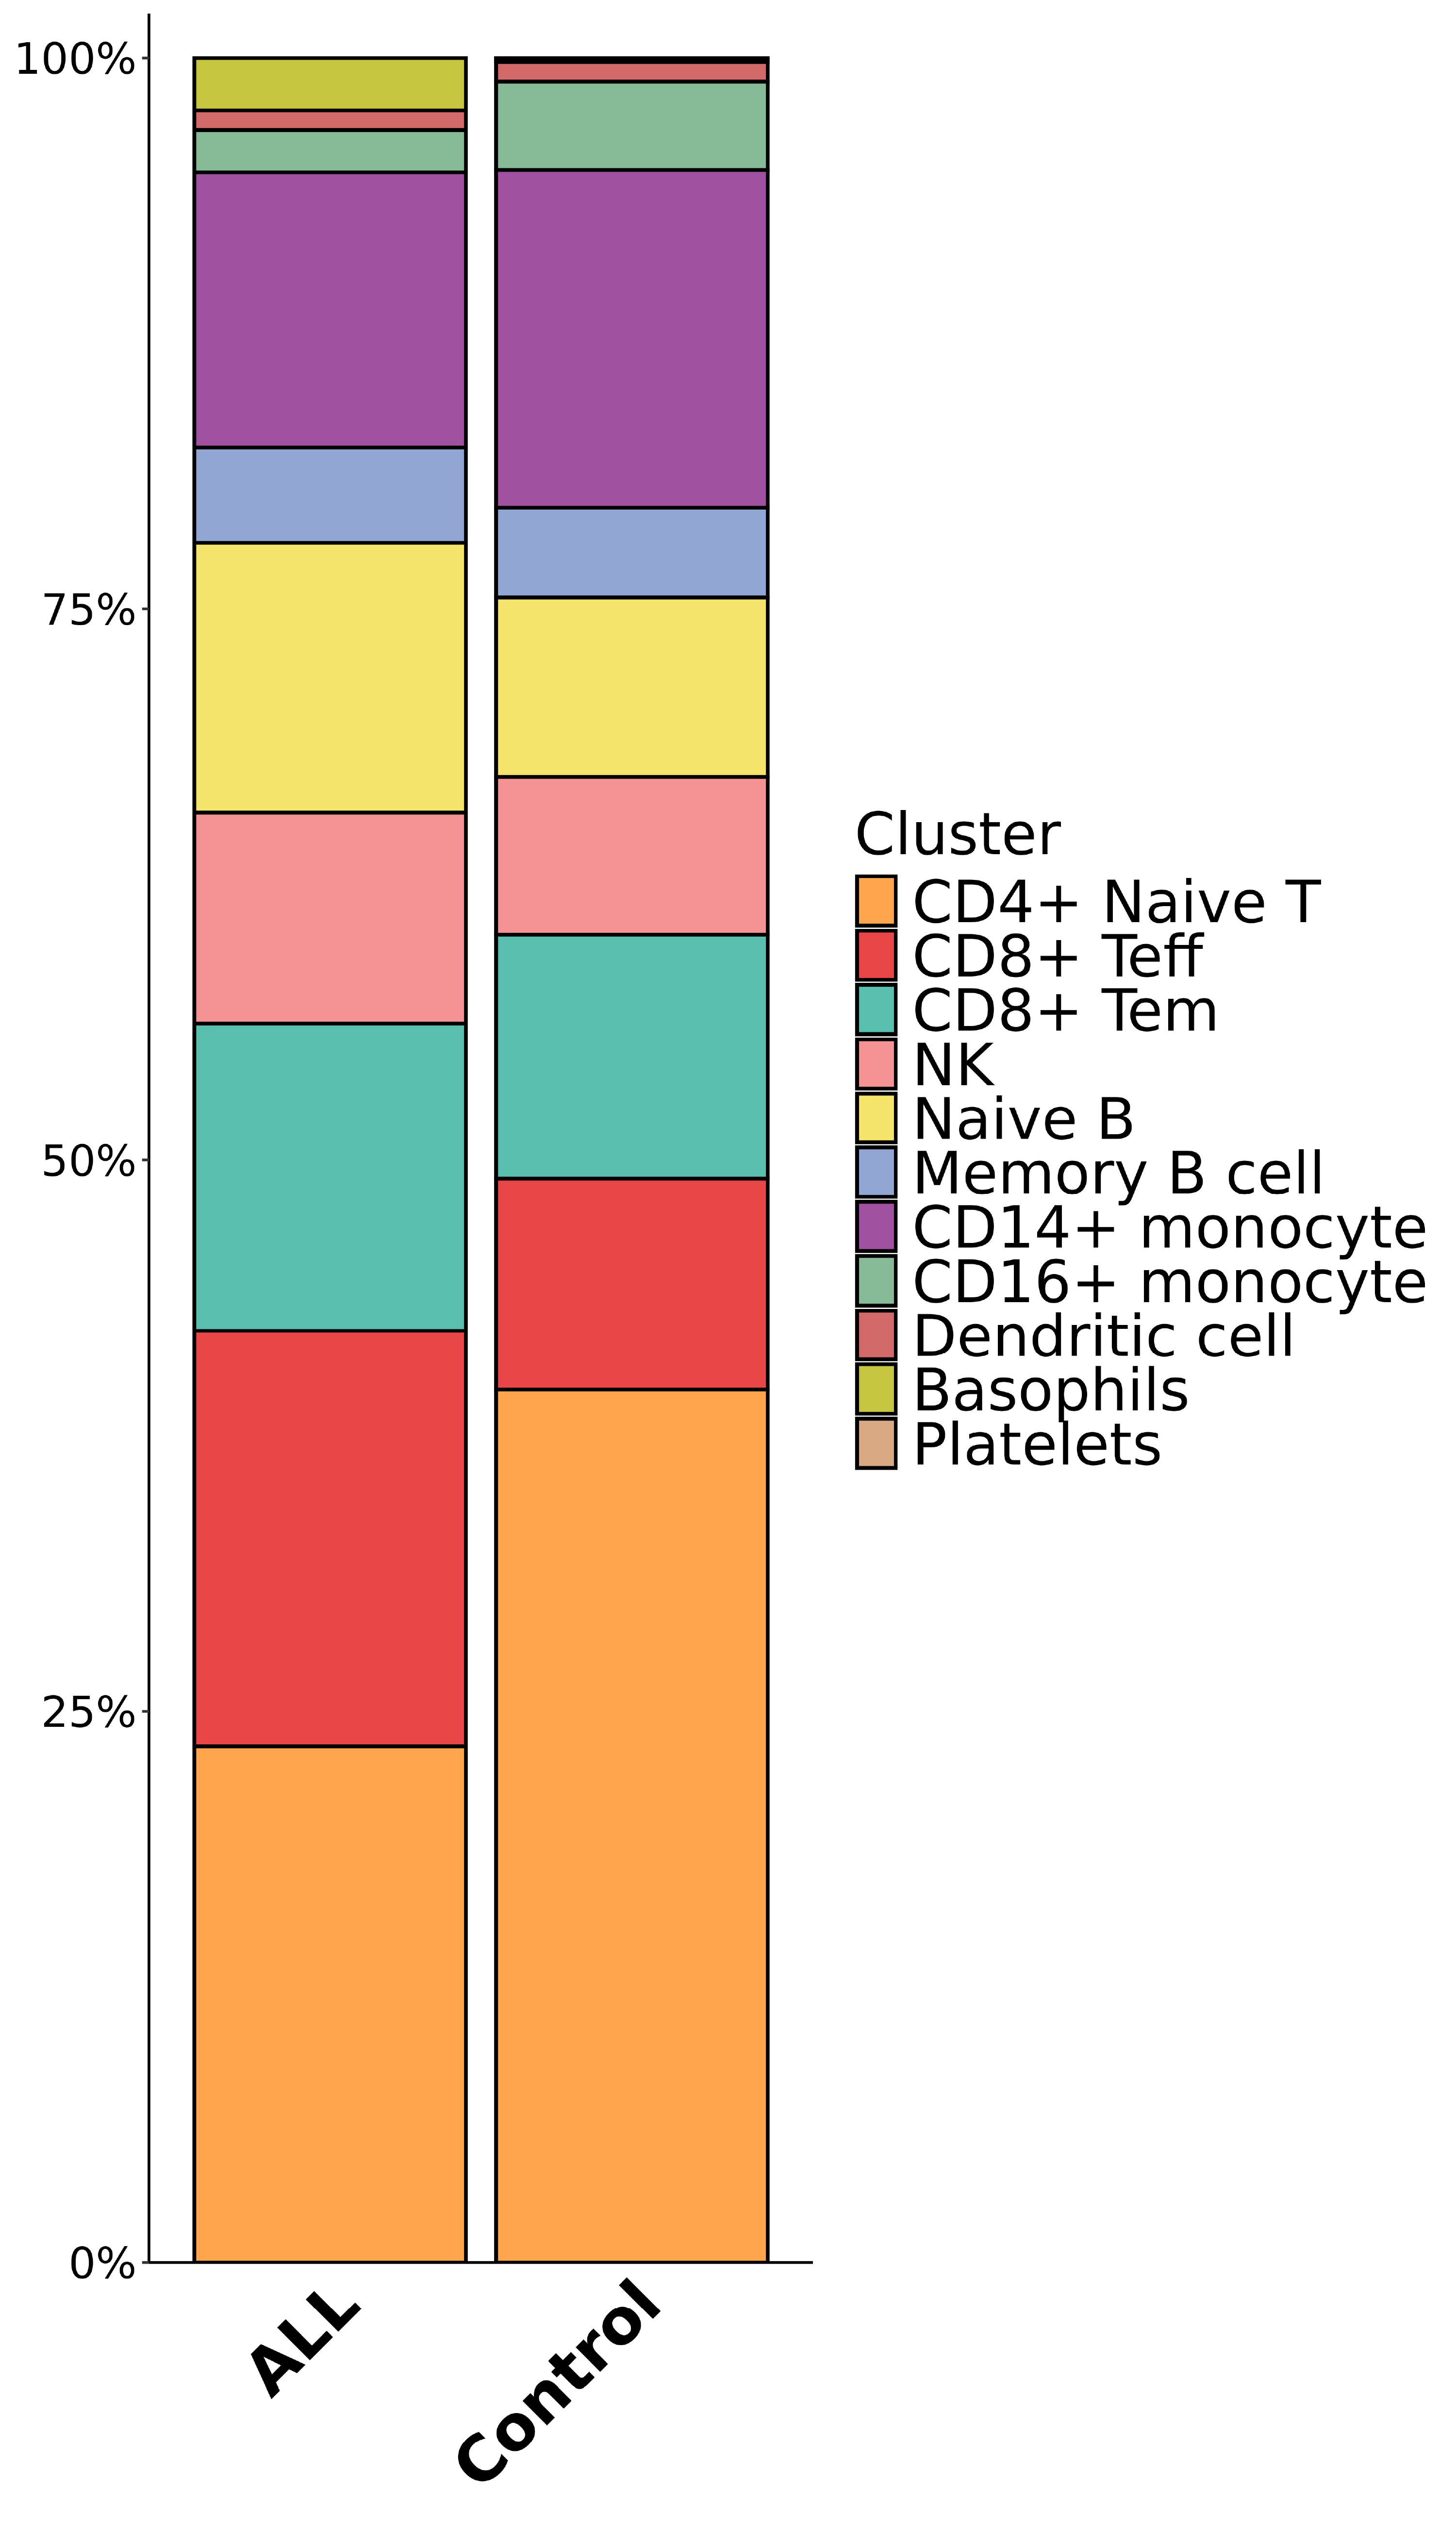
Cell proportion (pie/bar chart)
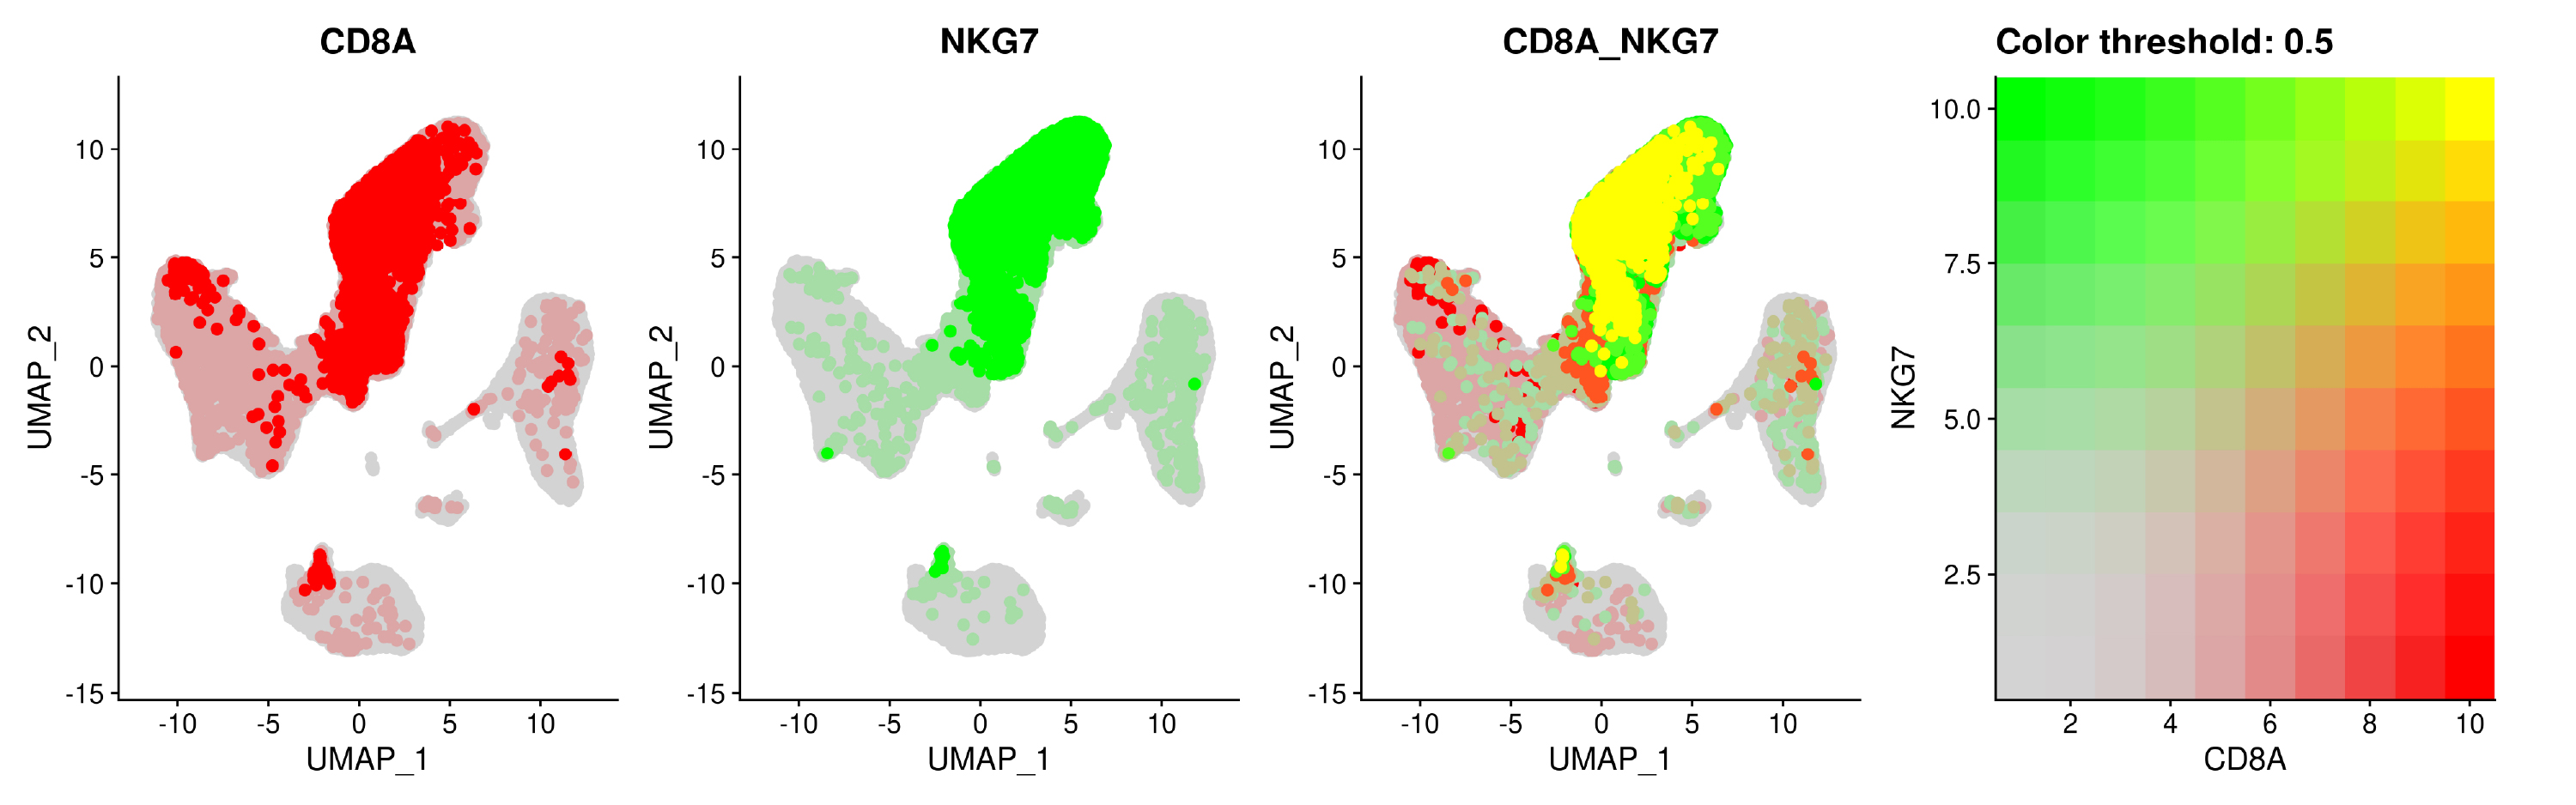
Dual feature plot
Feature/Dot plot for annotated cell types

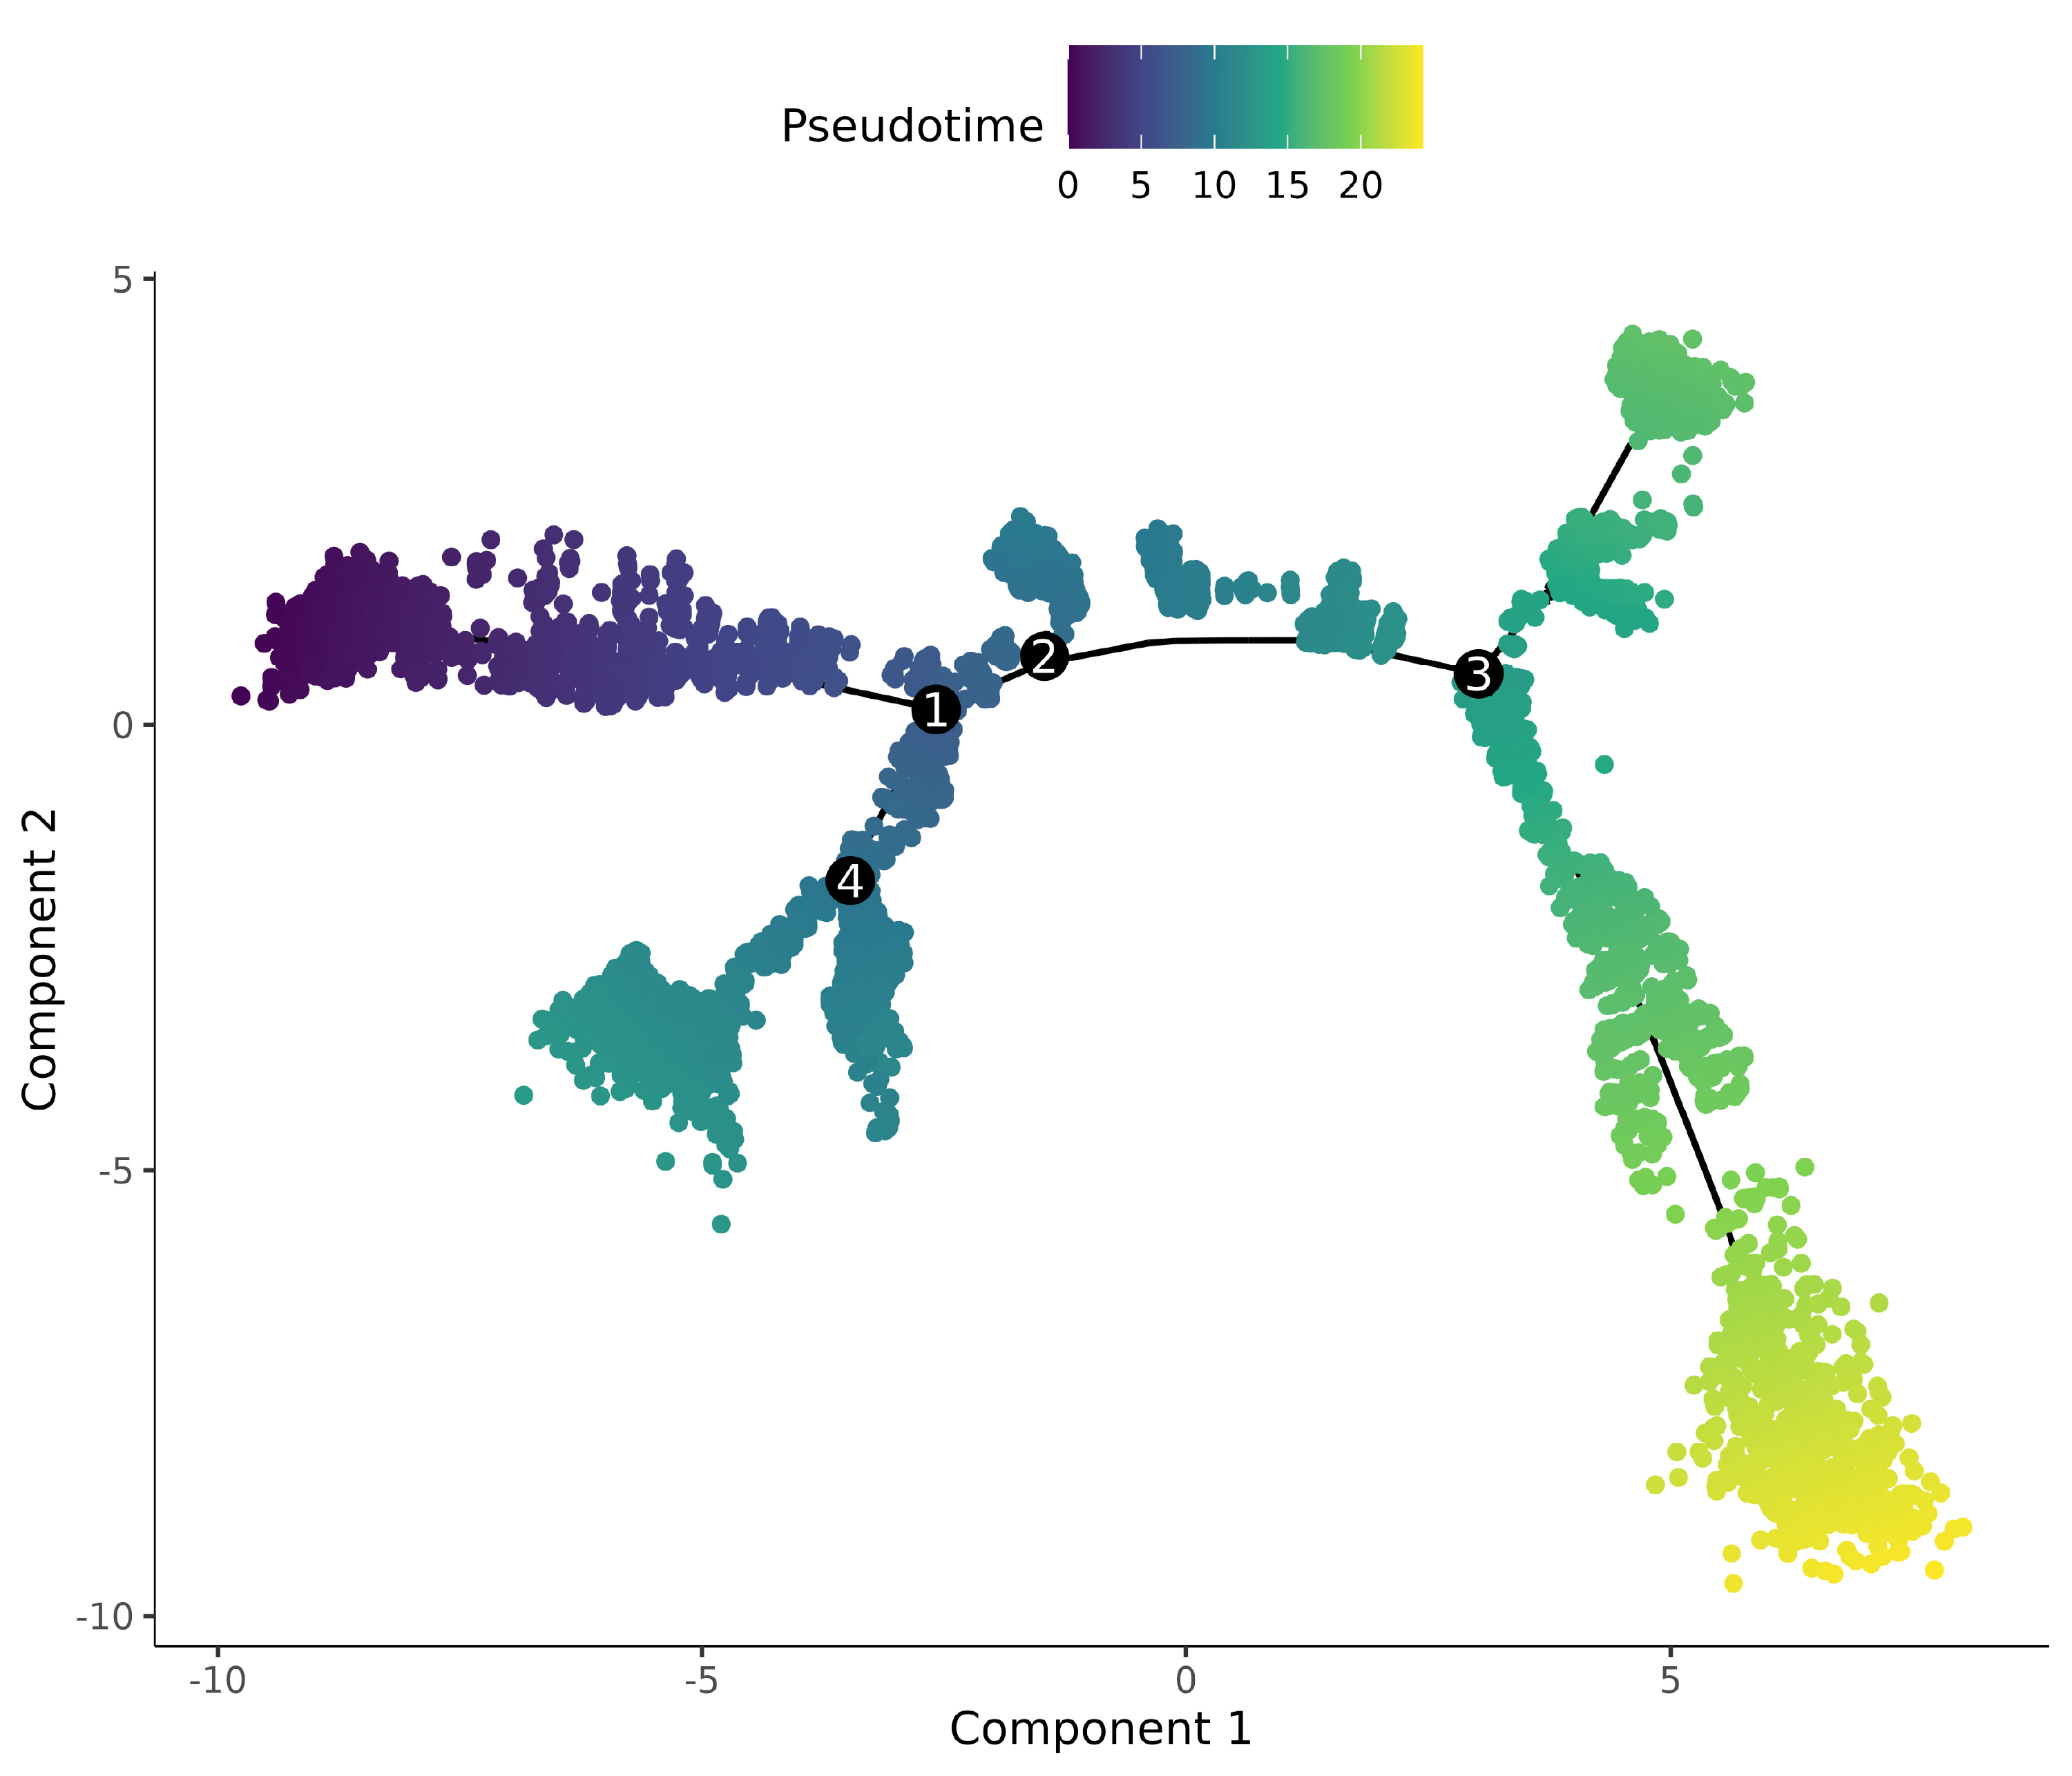
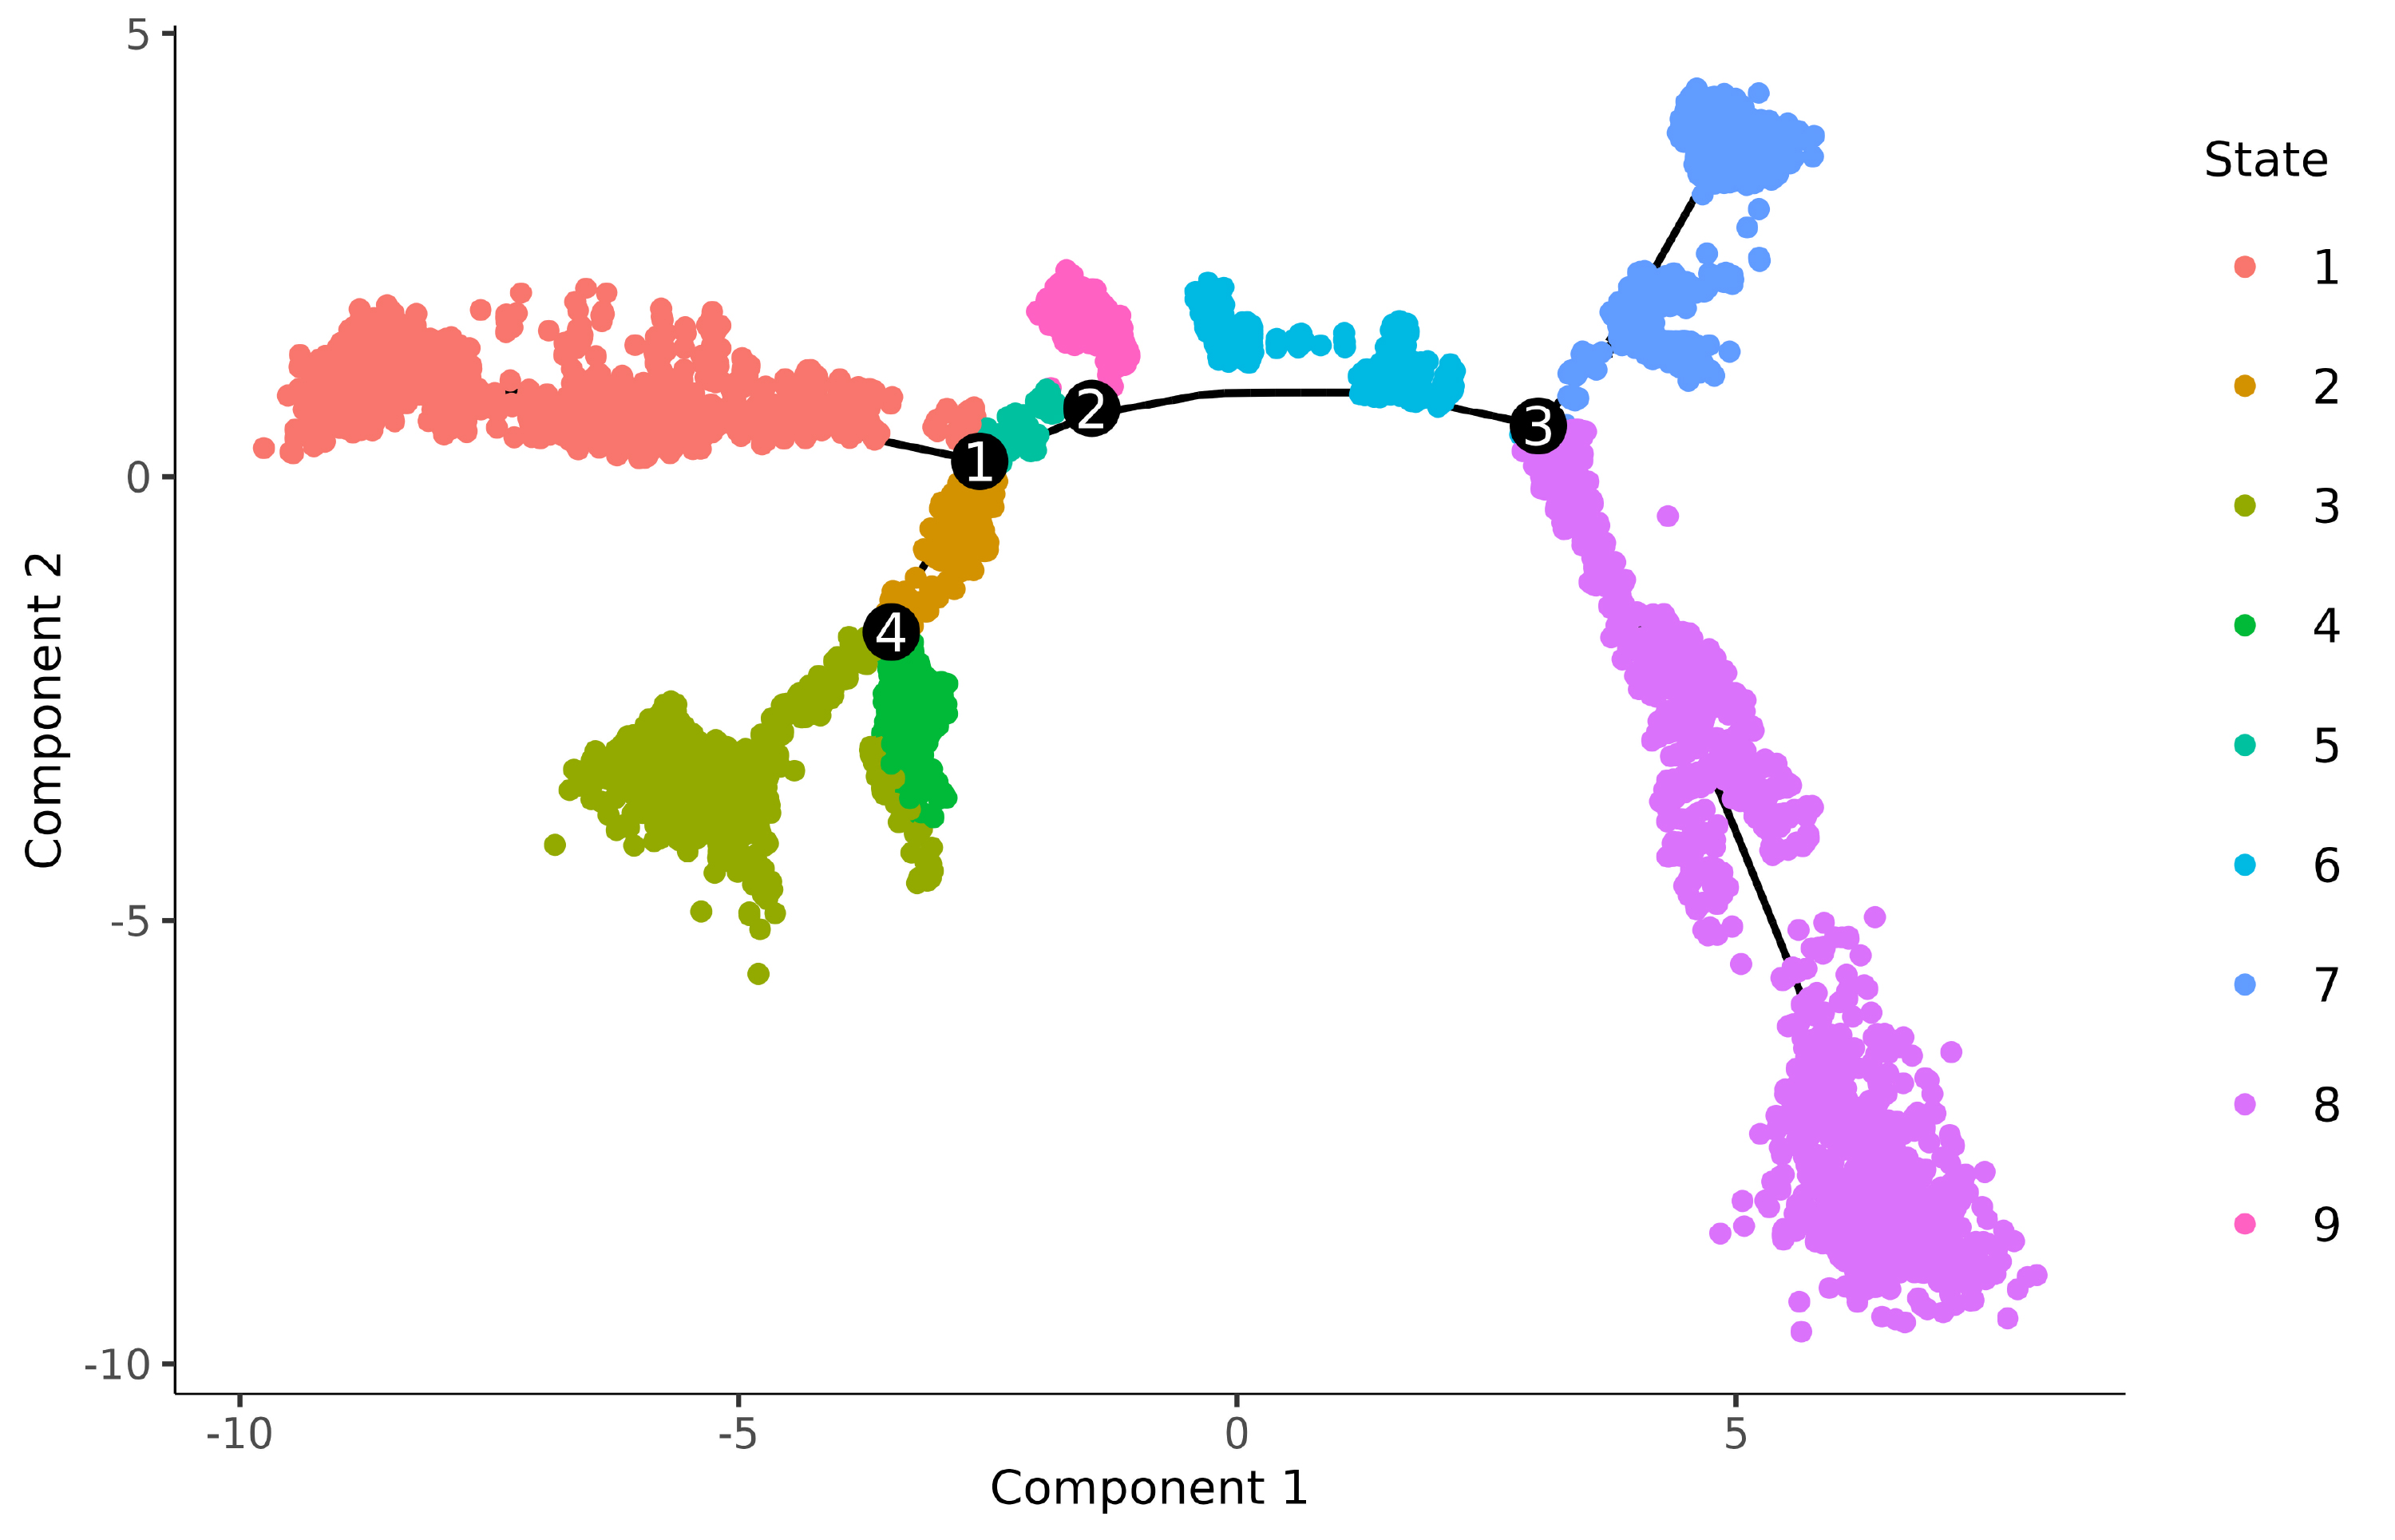
Trajectory analysis (pseudotime/state)
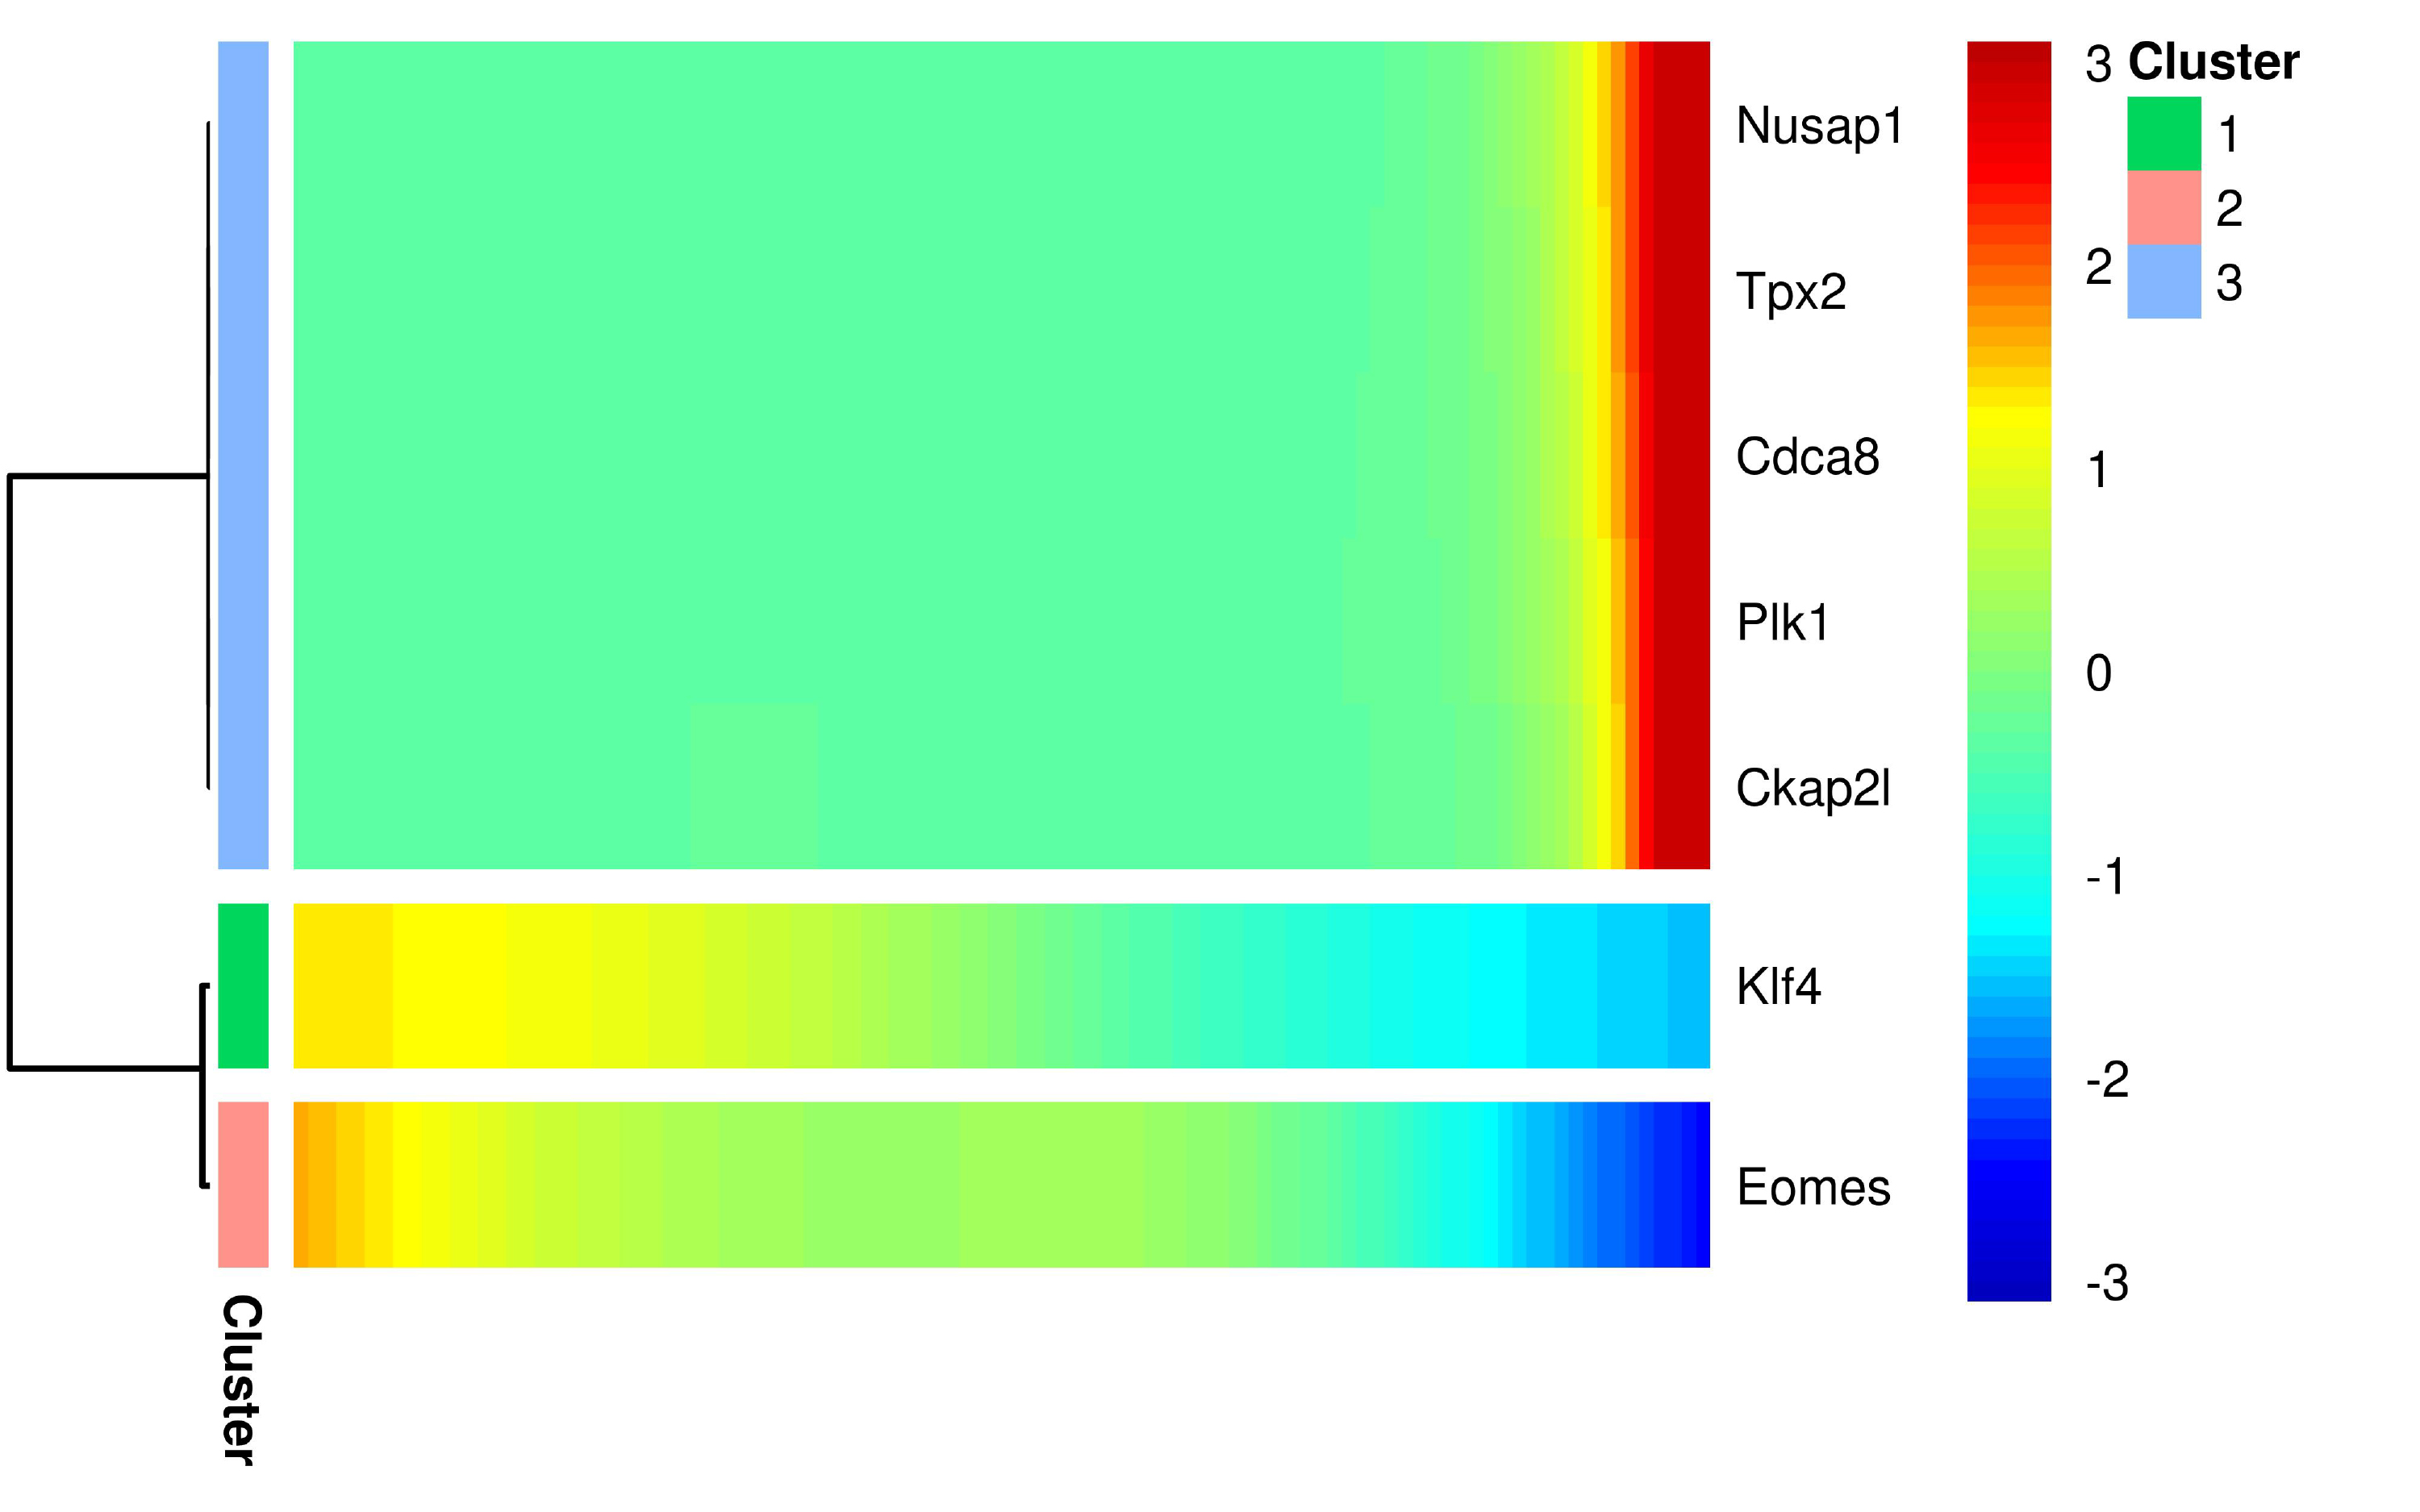
Trajectory heatmap
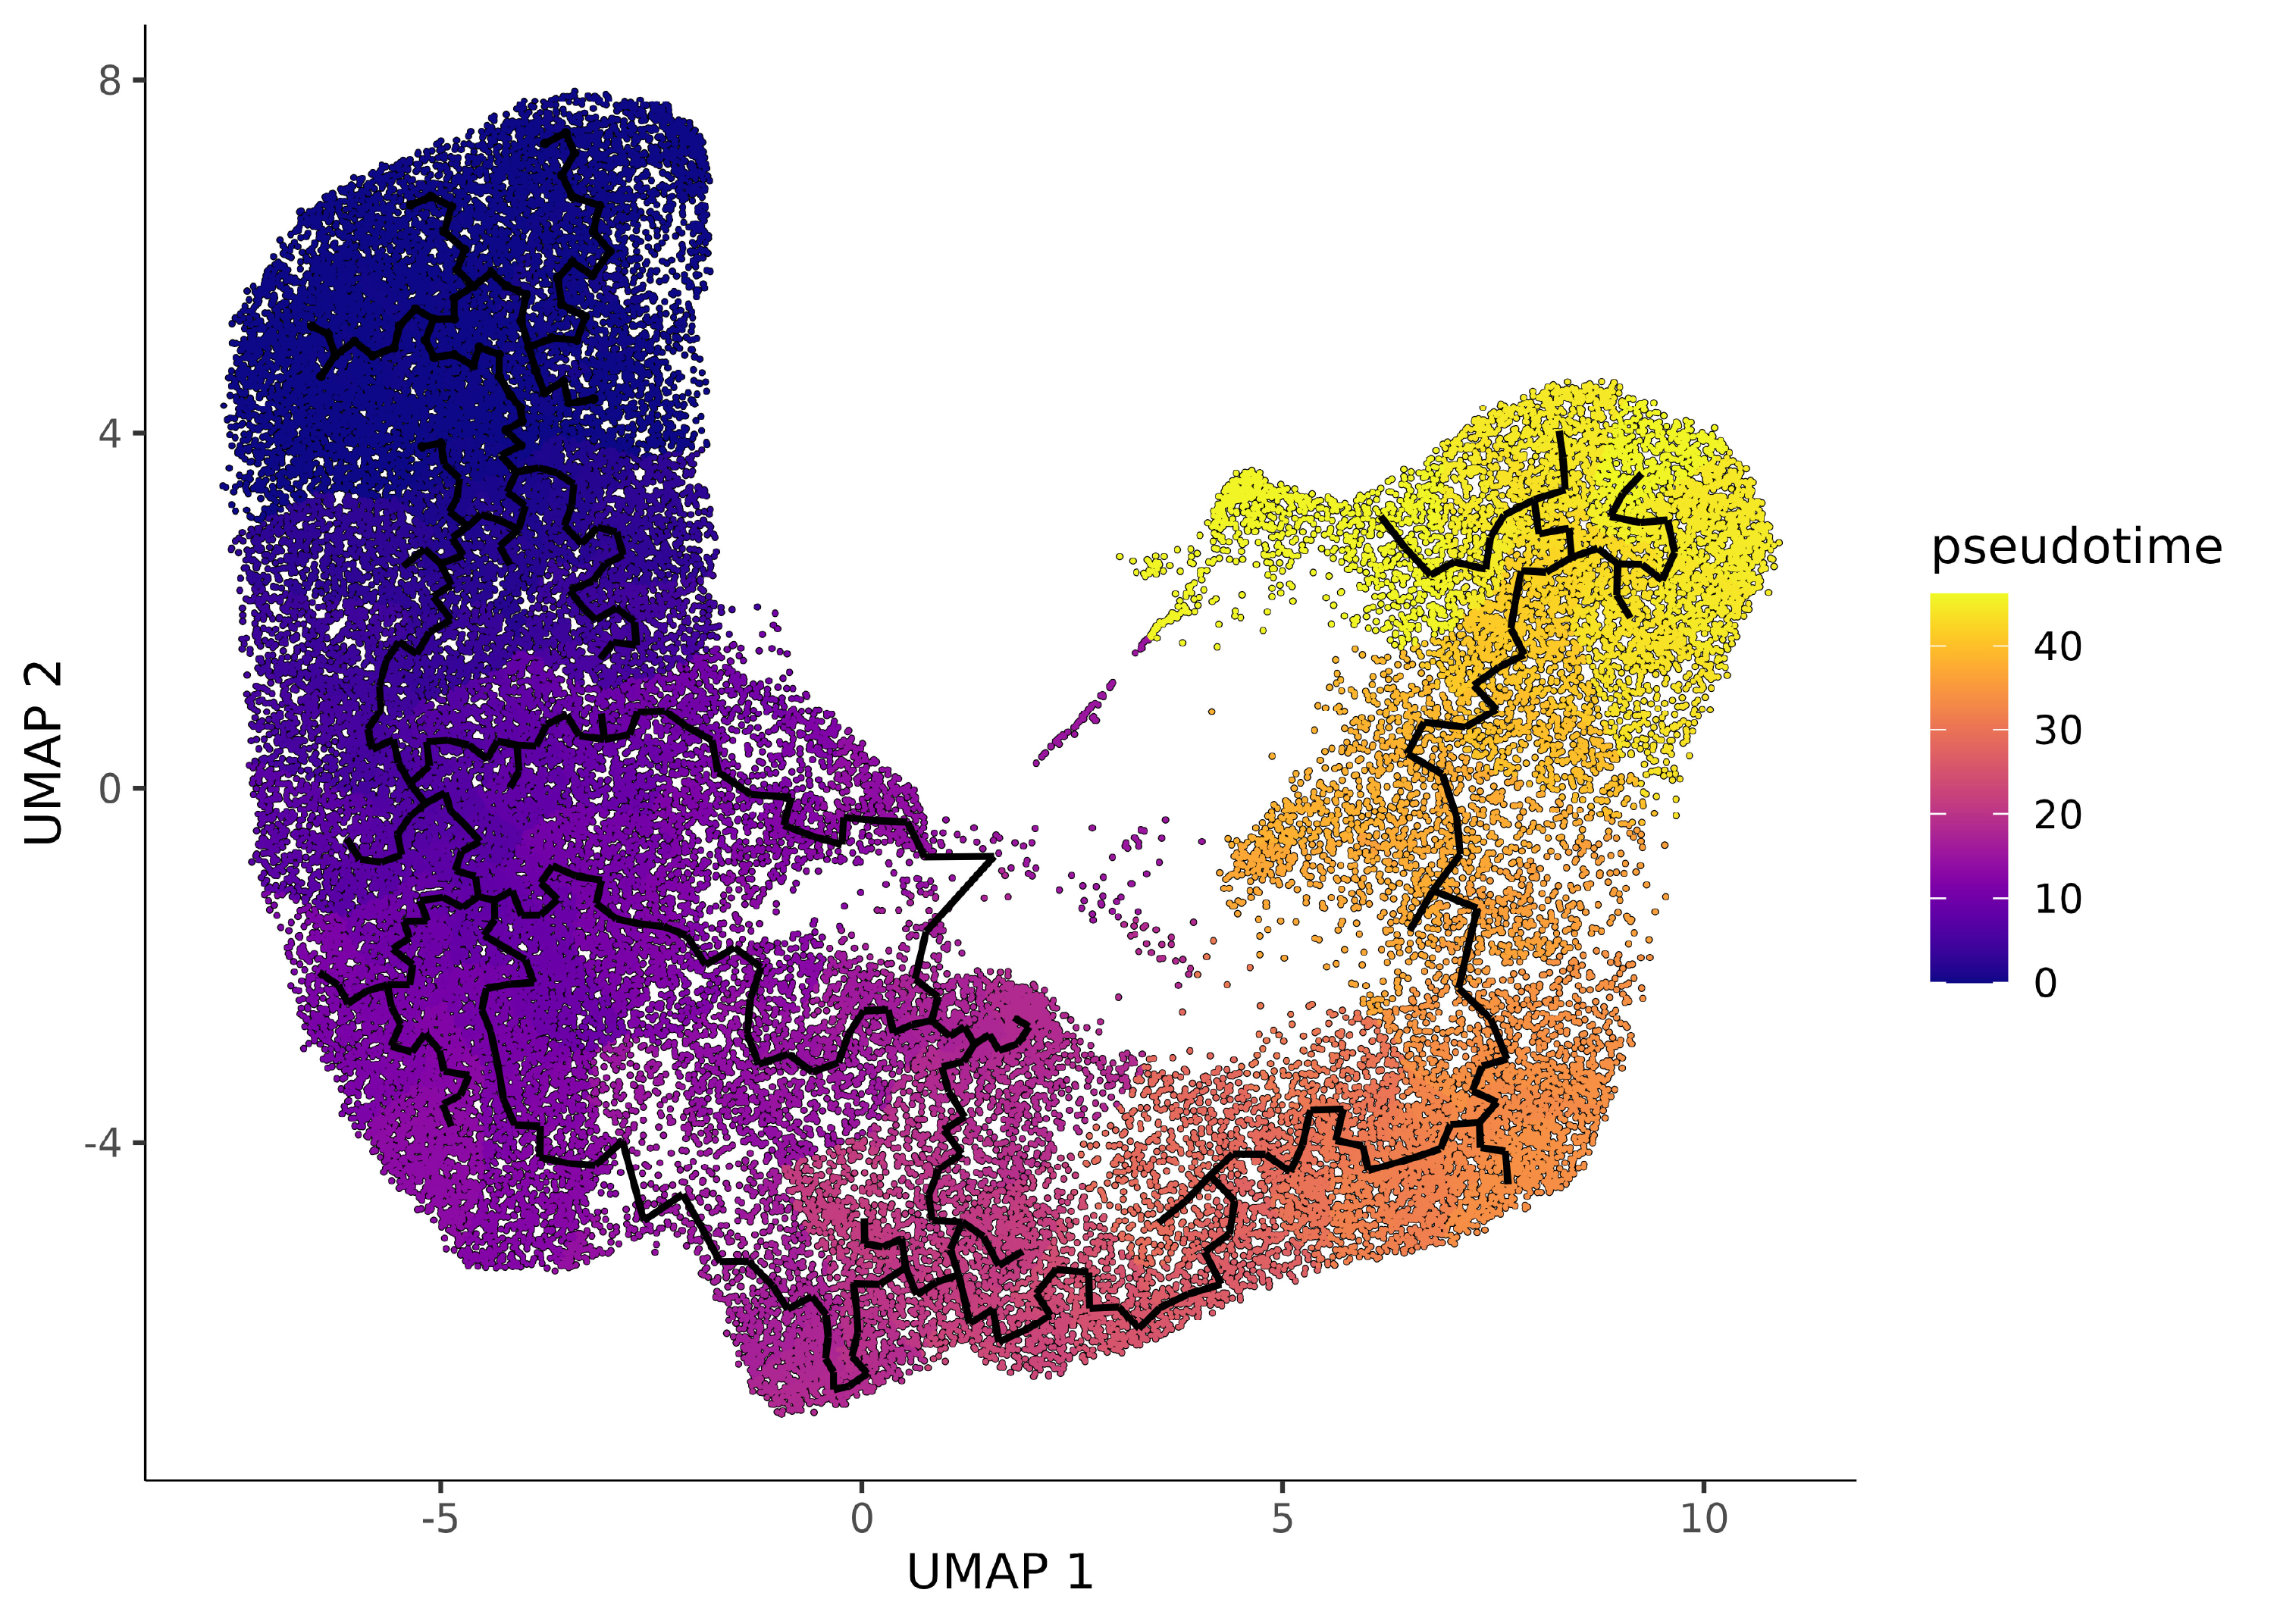
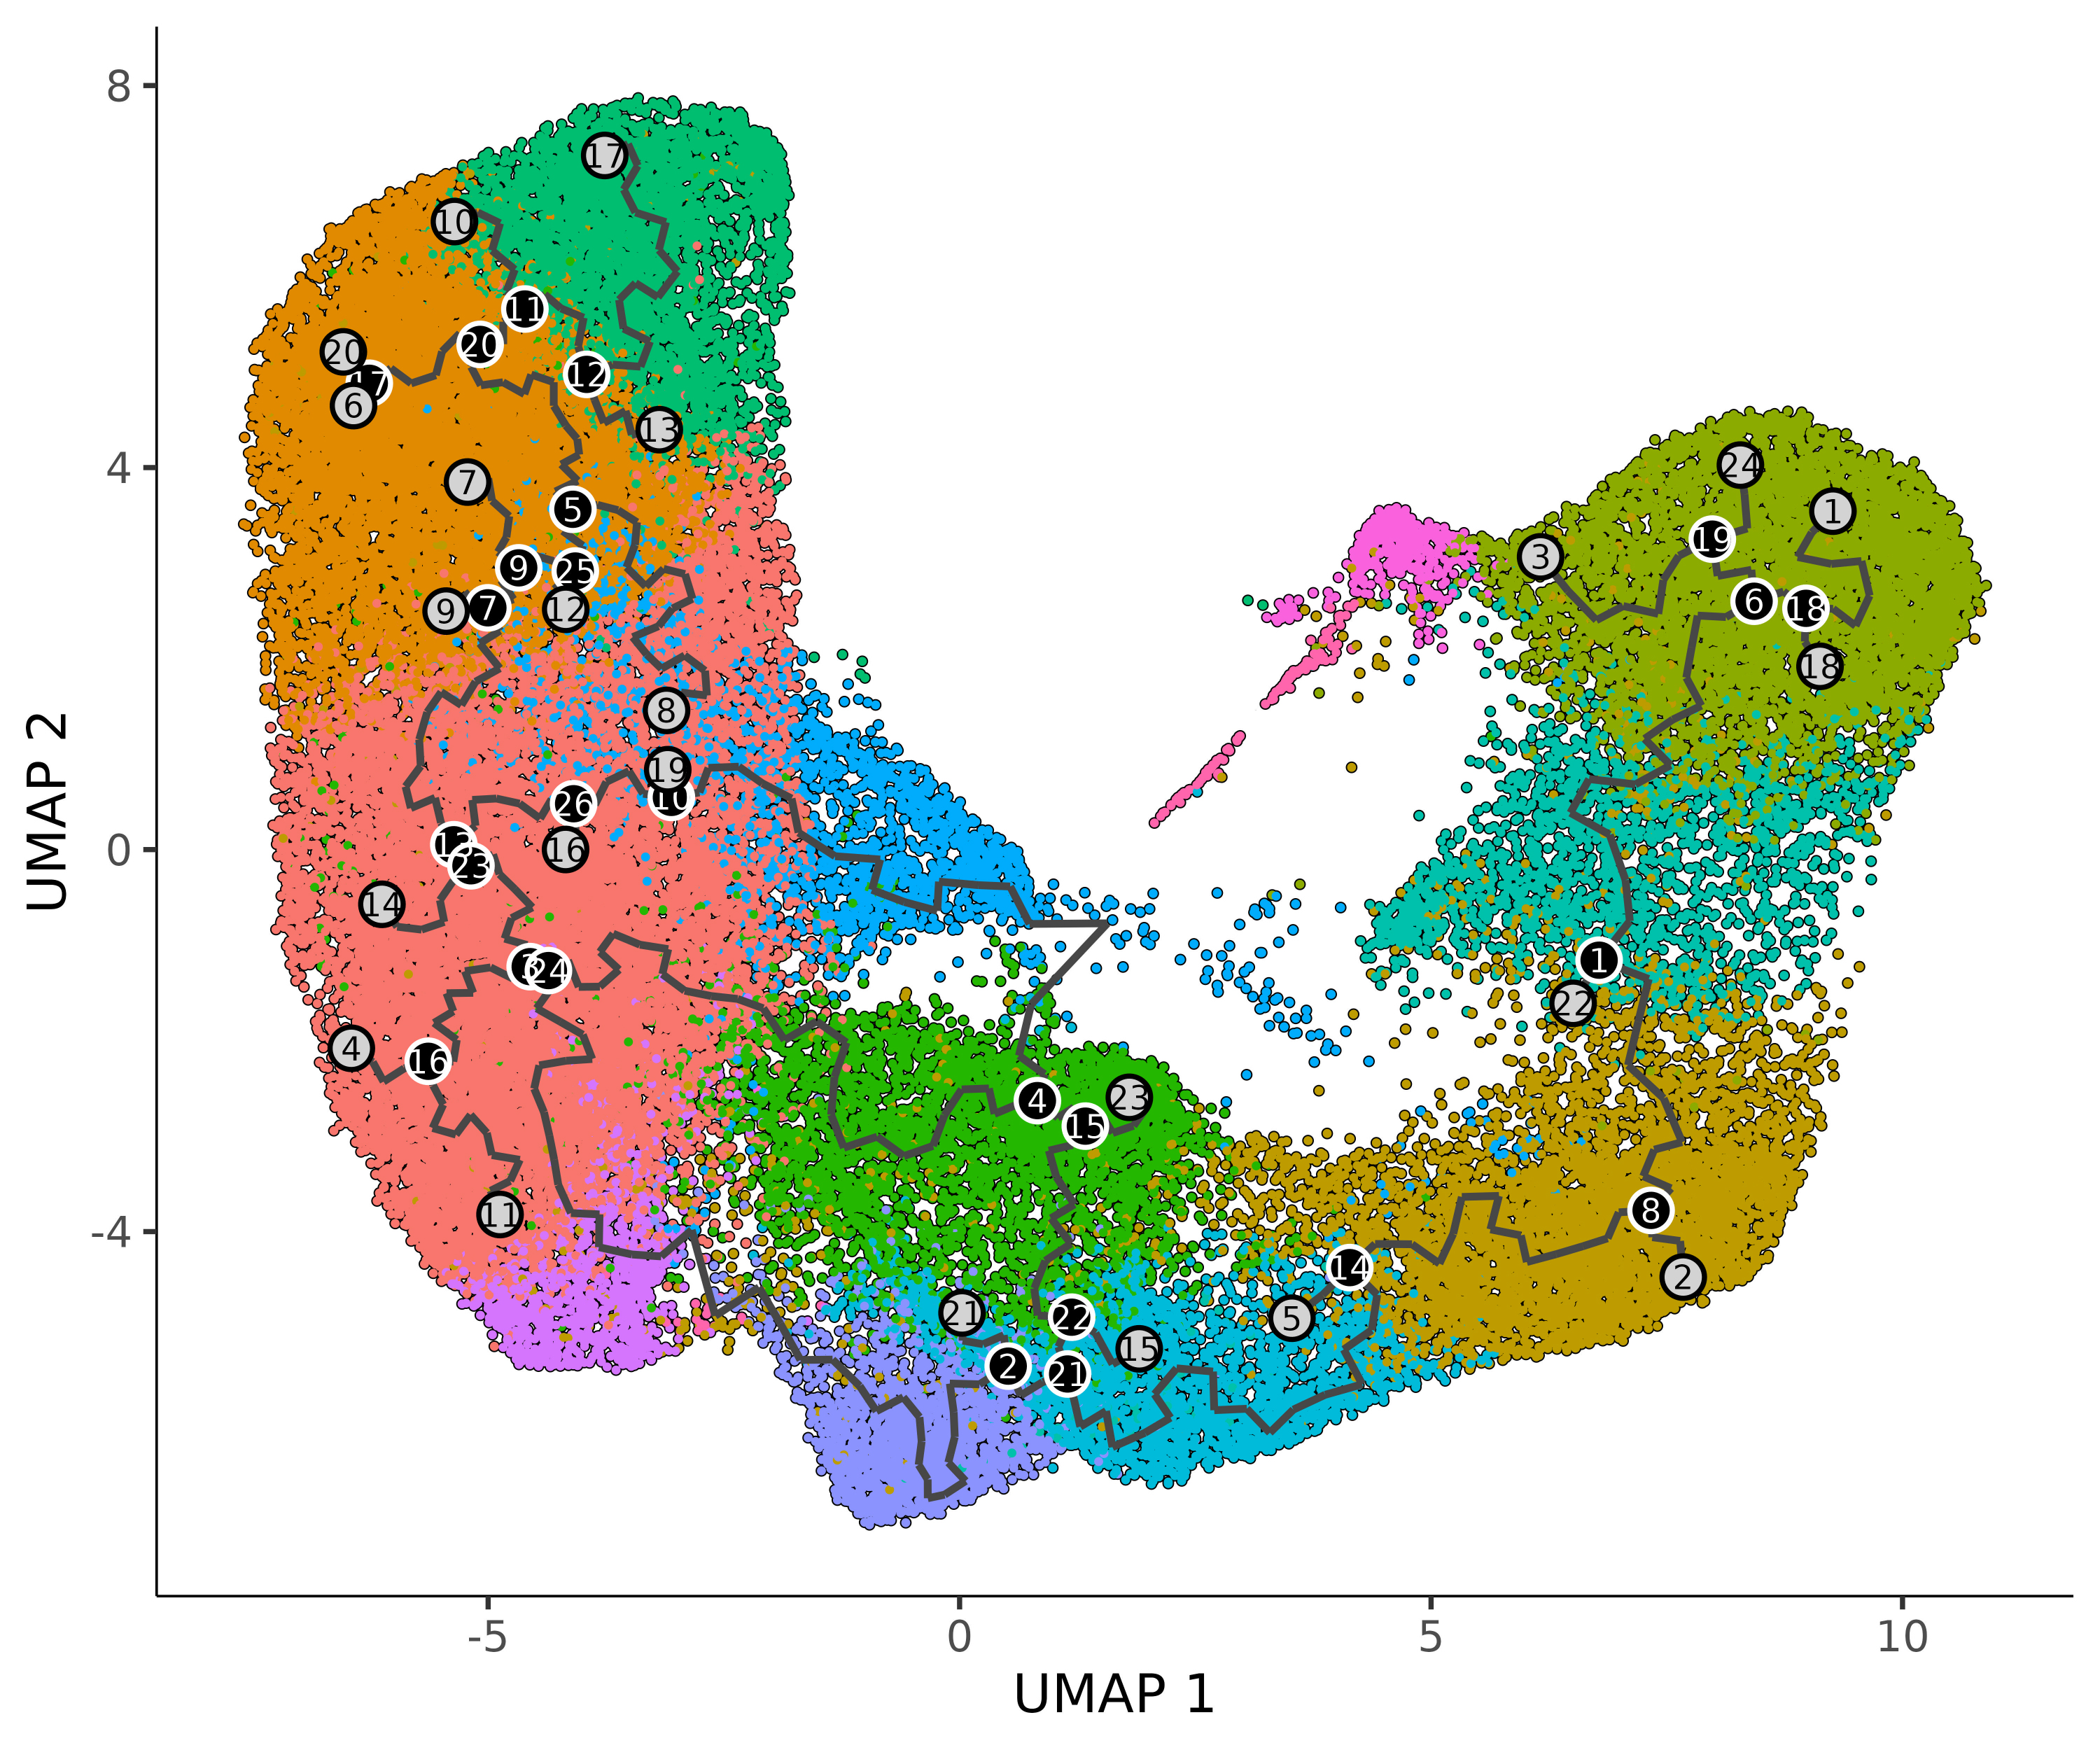
Trajectory analysis (Monocle3)
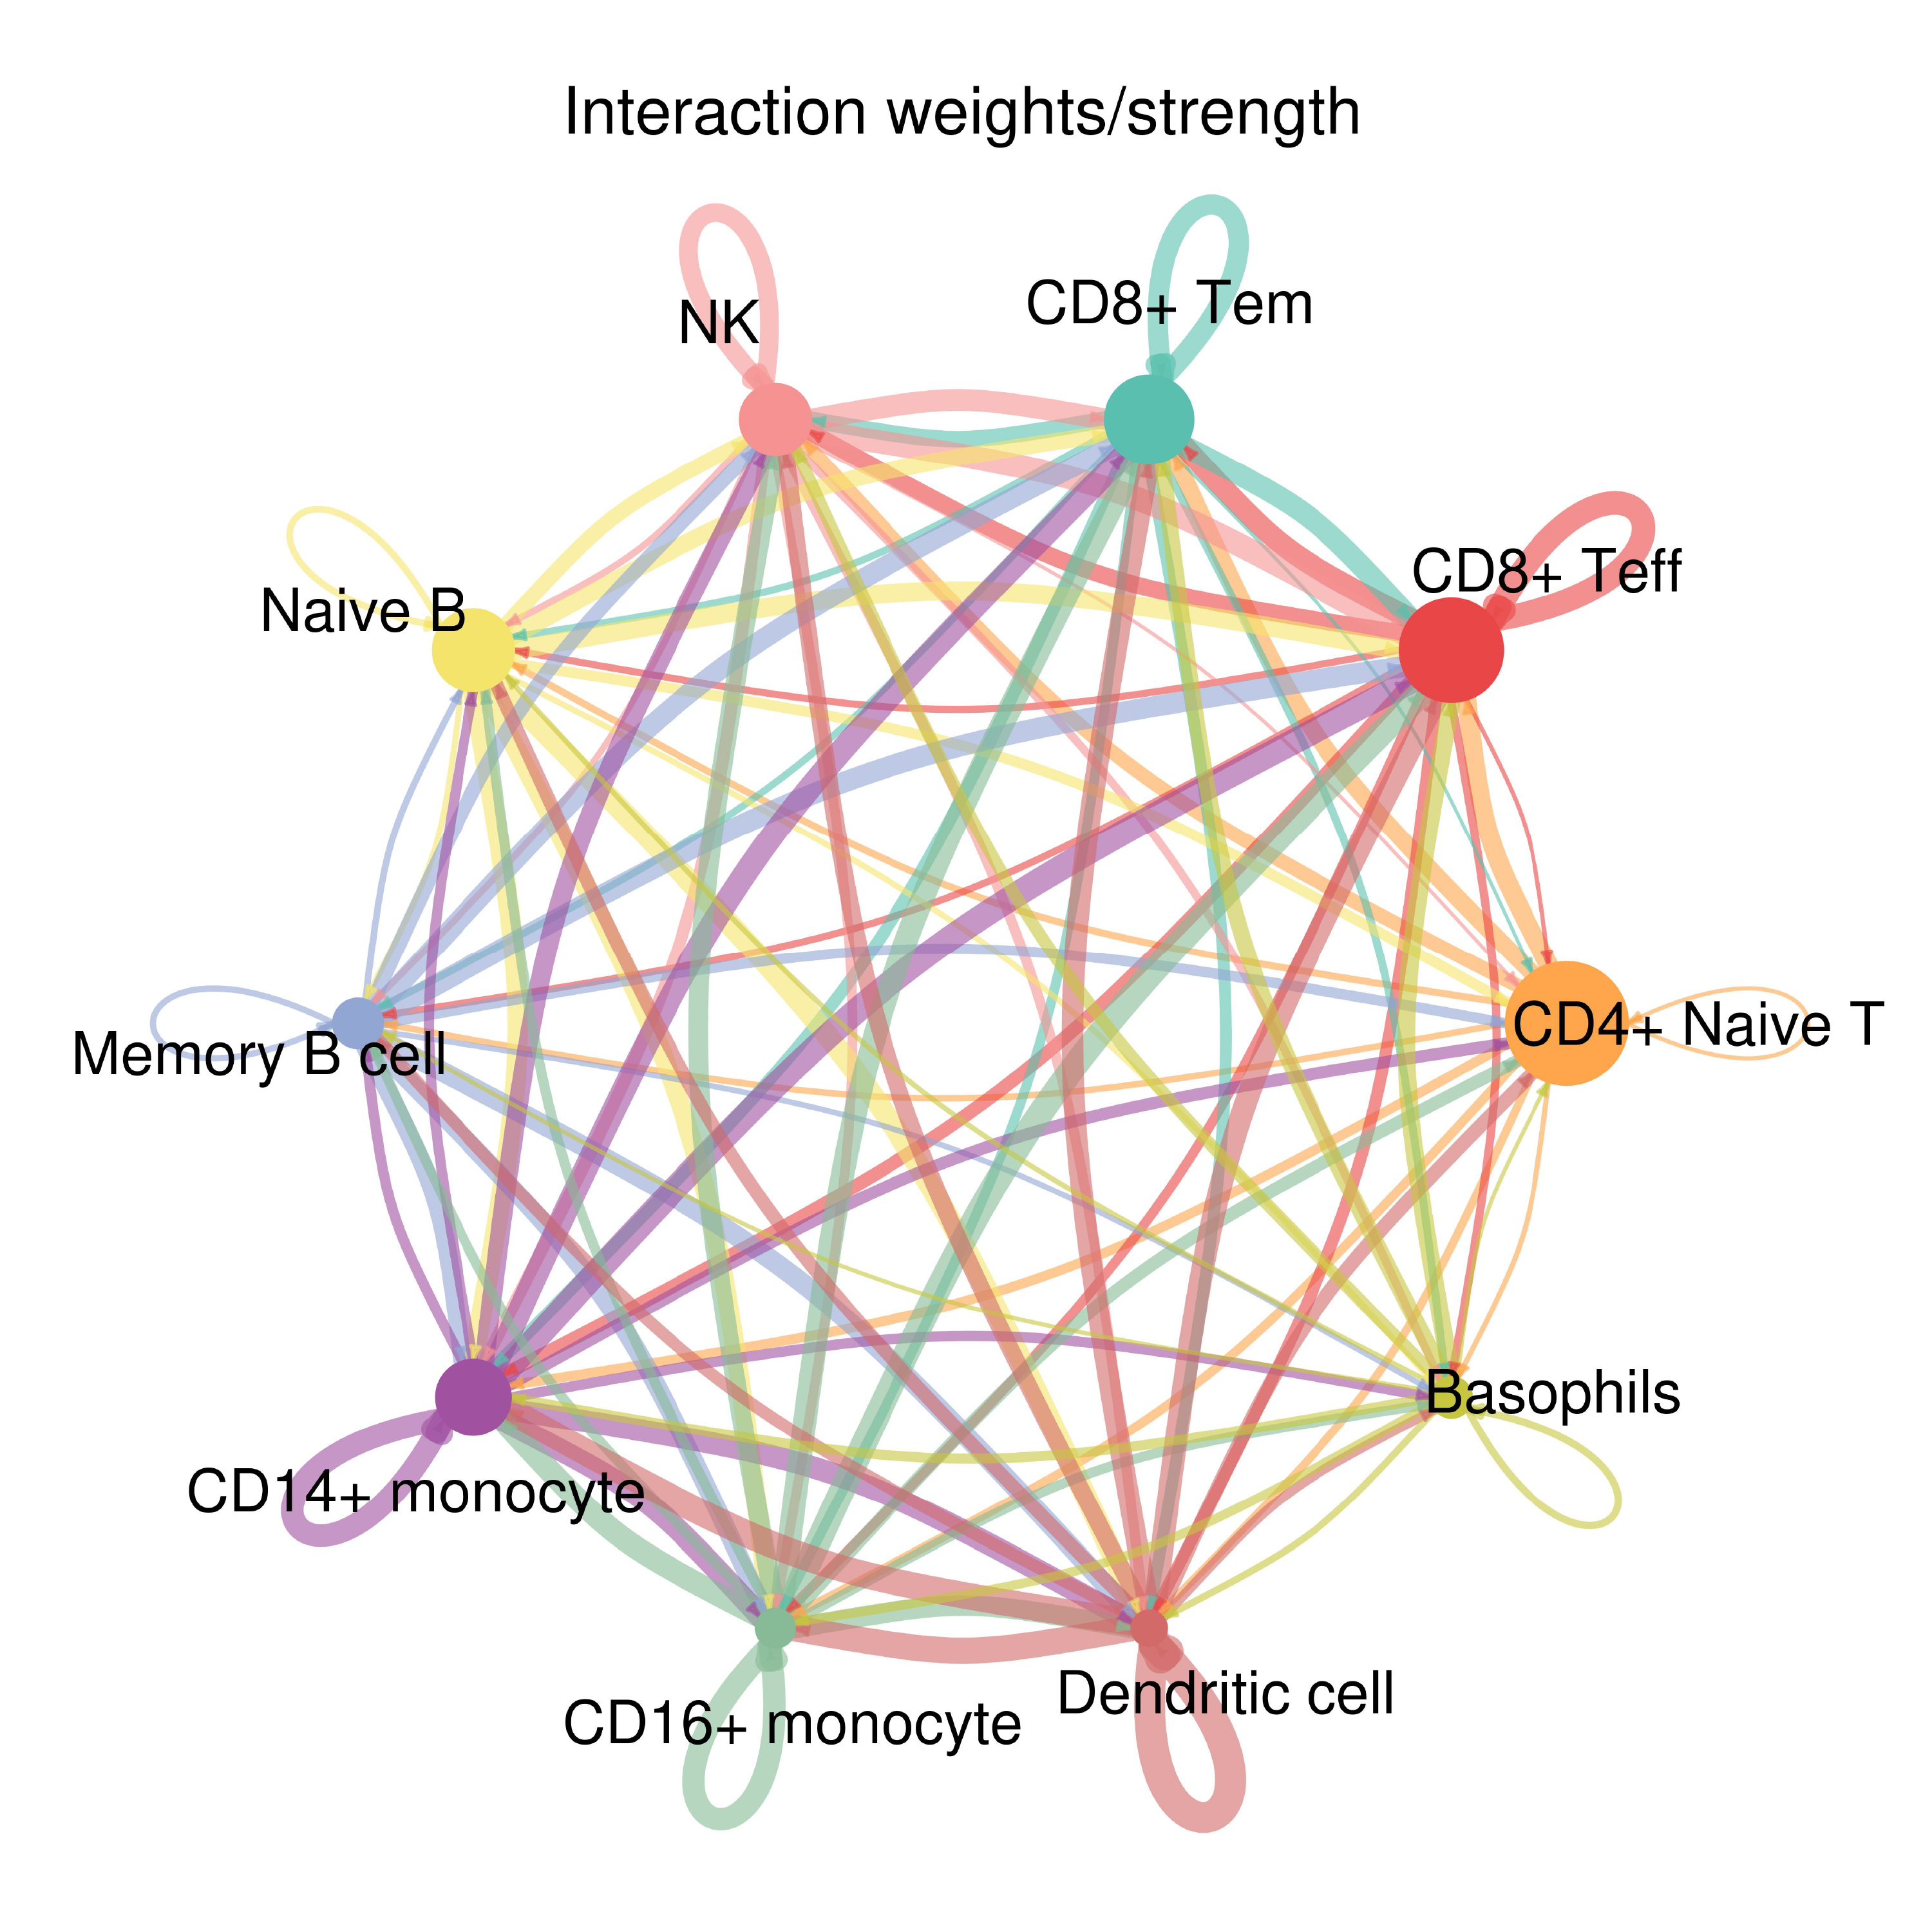
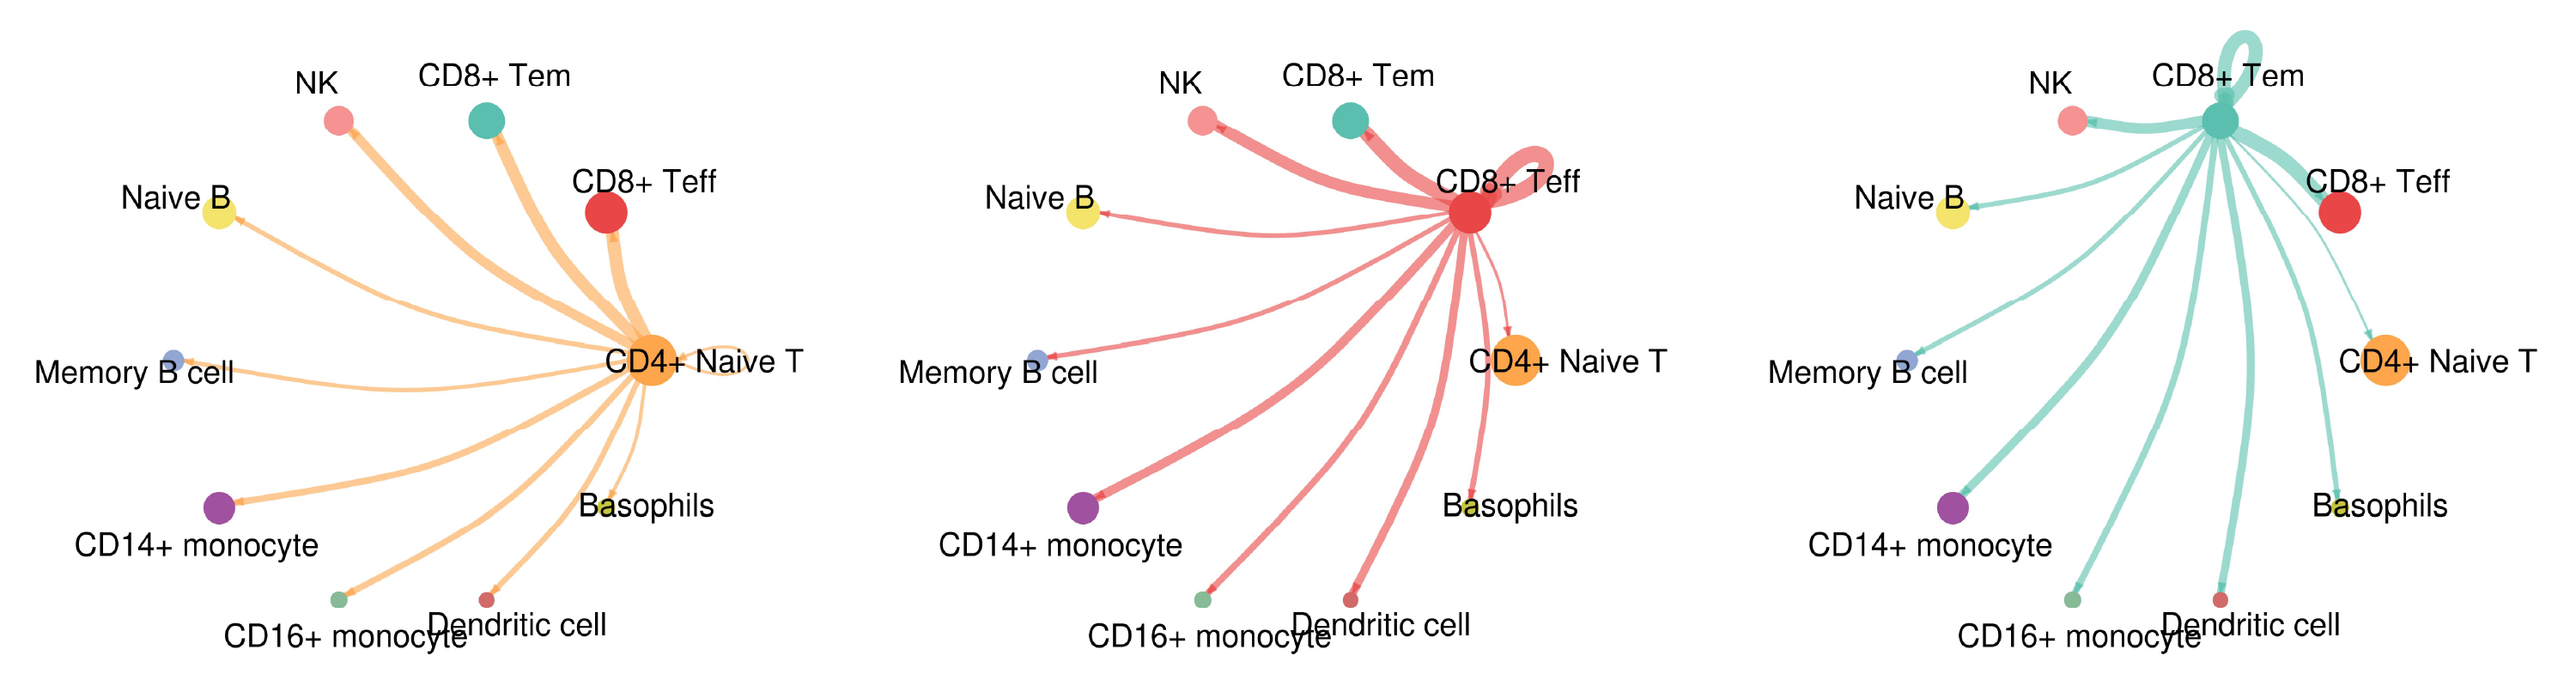
Cell-cell interaction (circle plot, directed network)
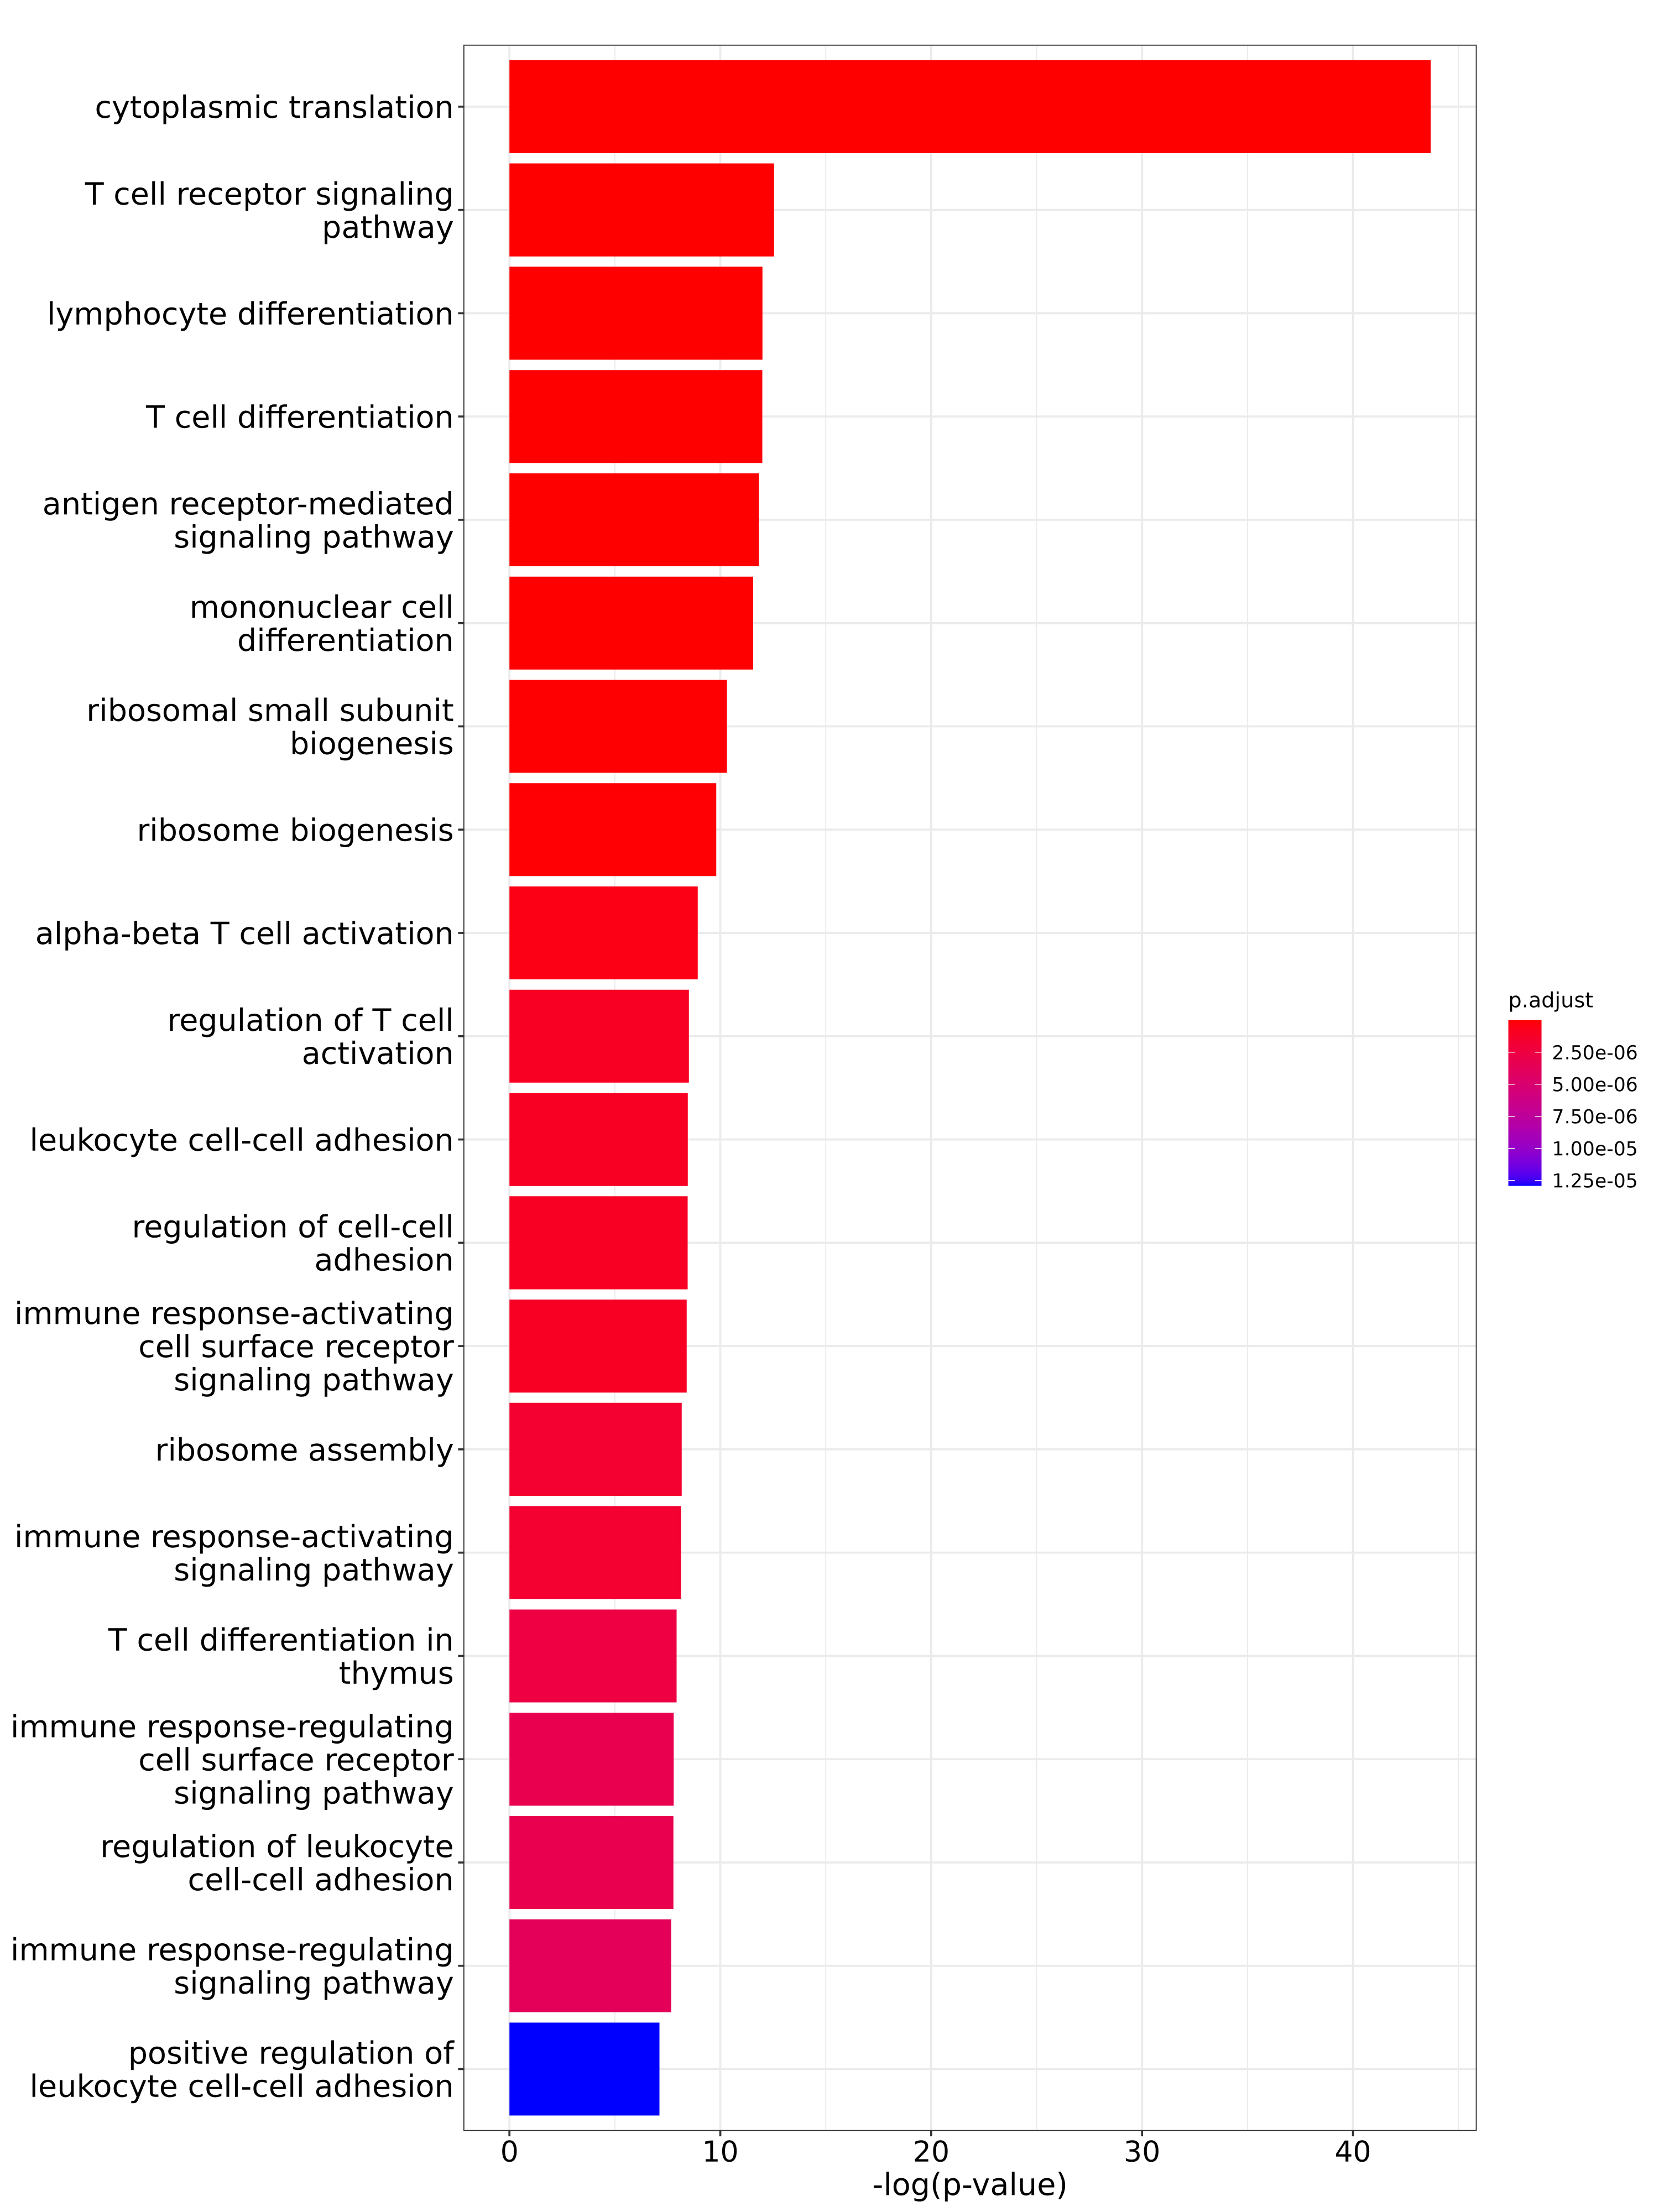
GO bar plot
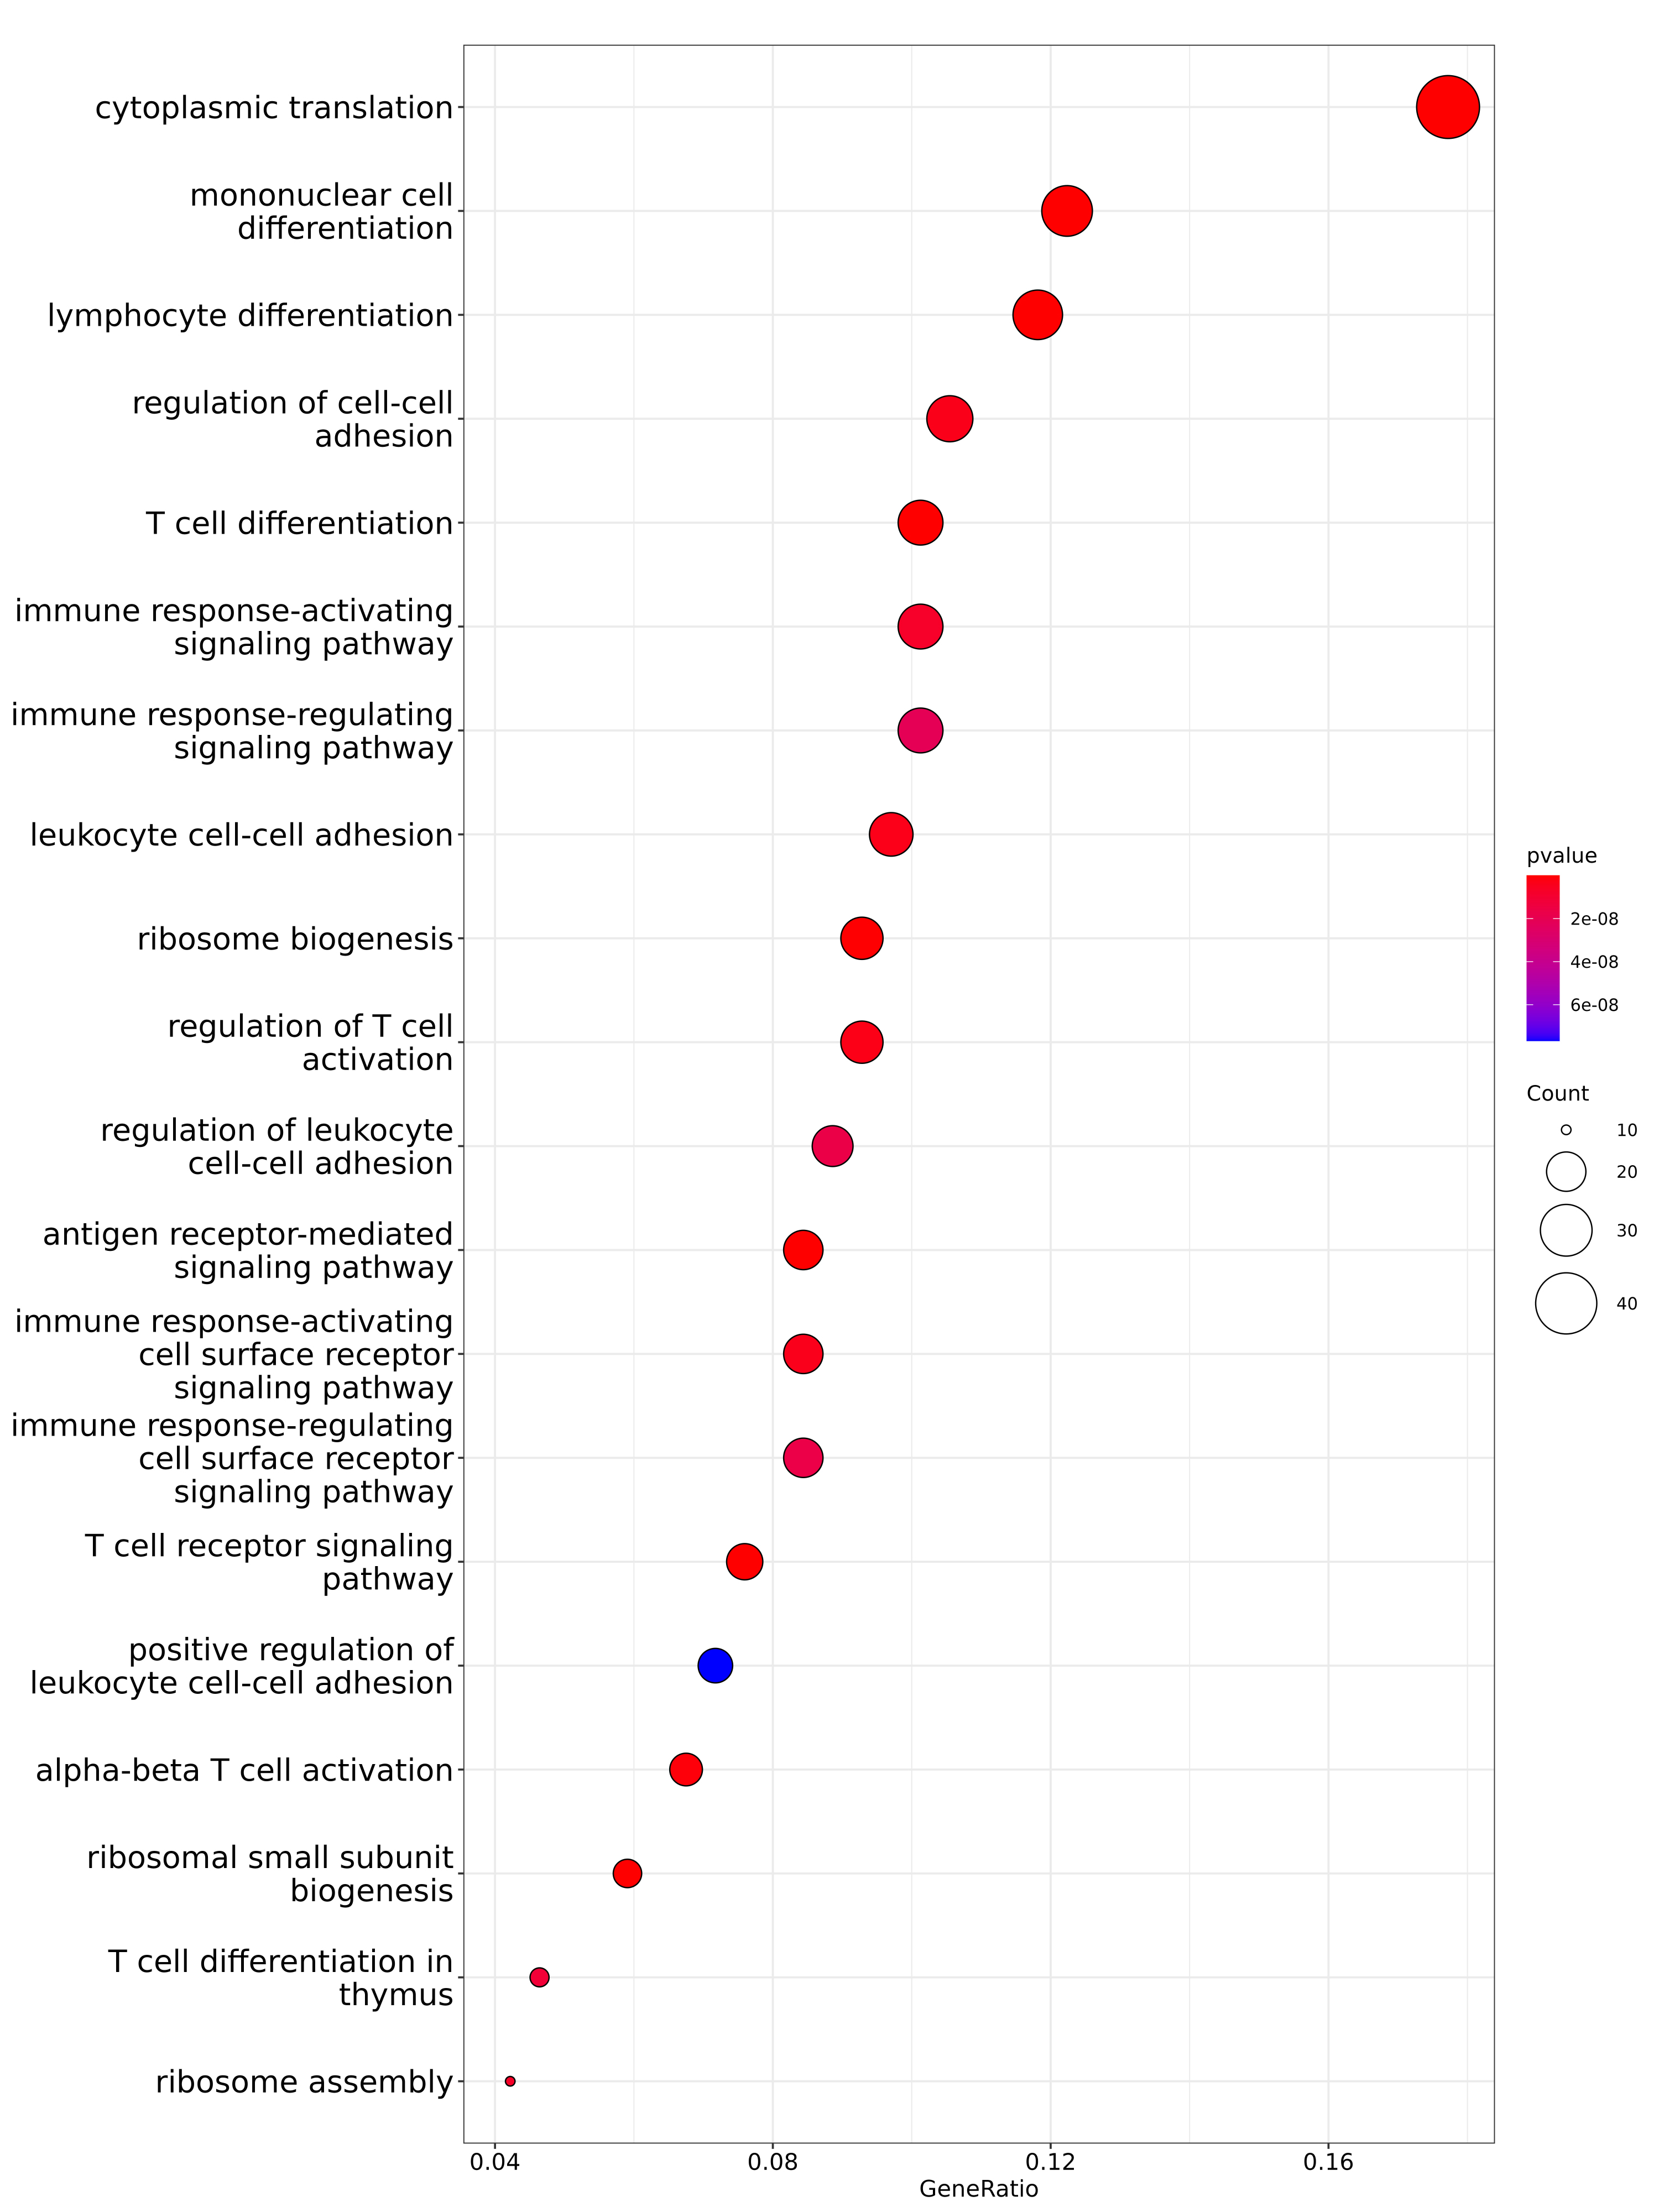
GO dot plot
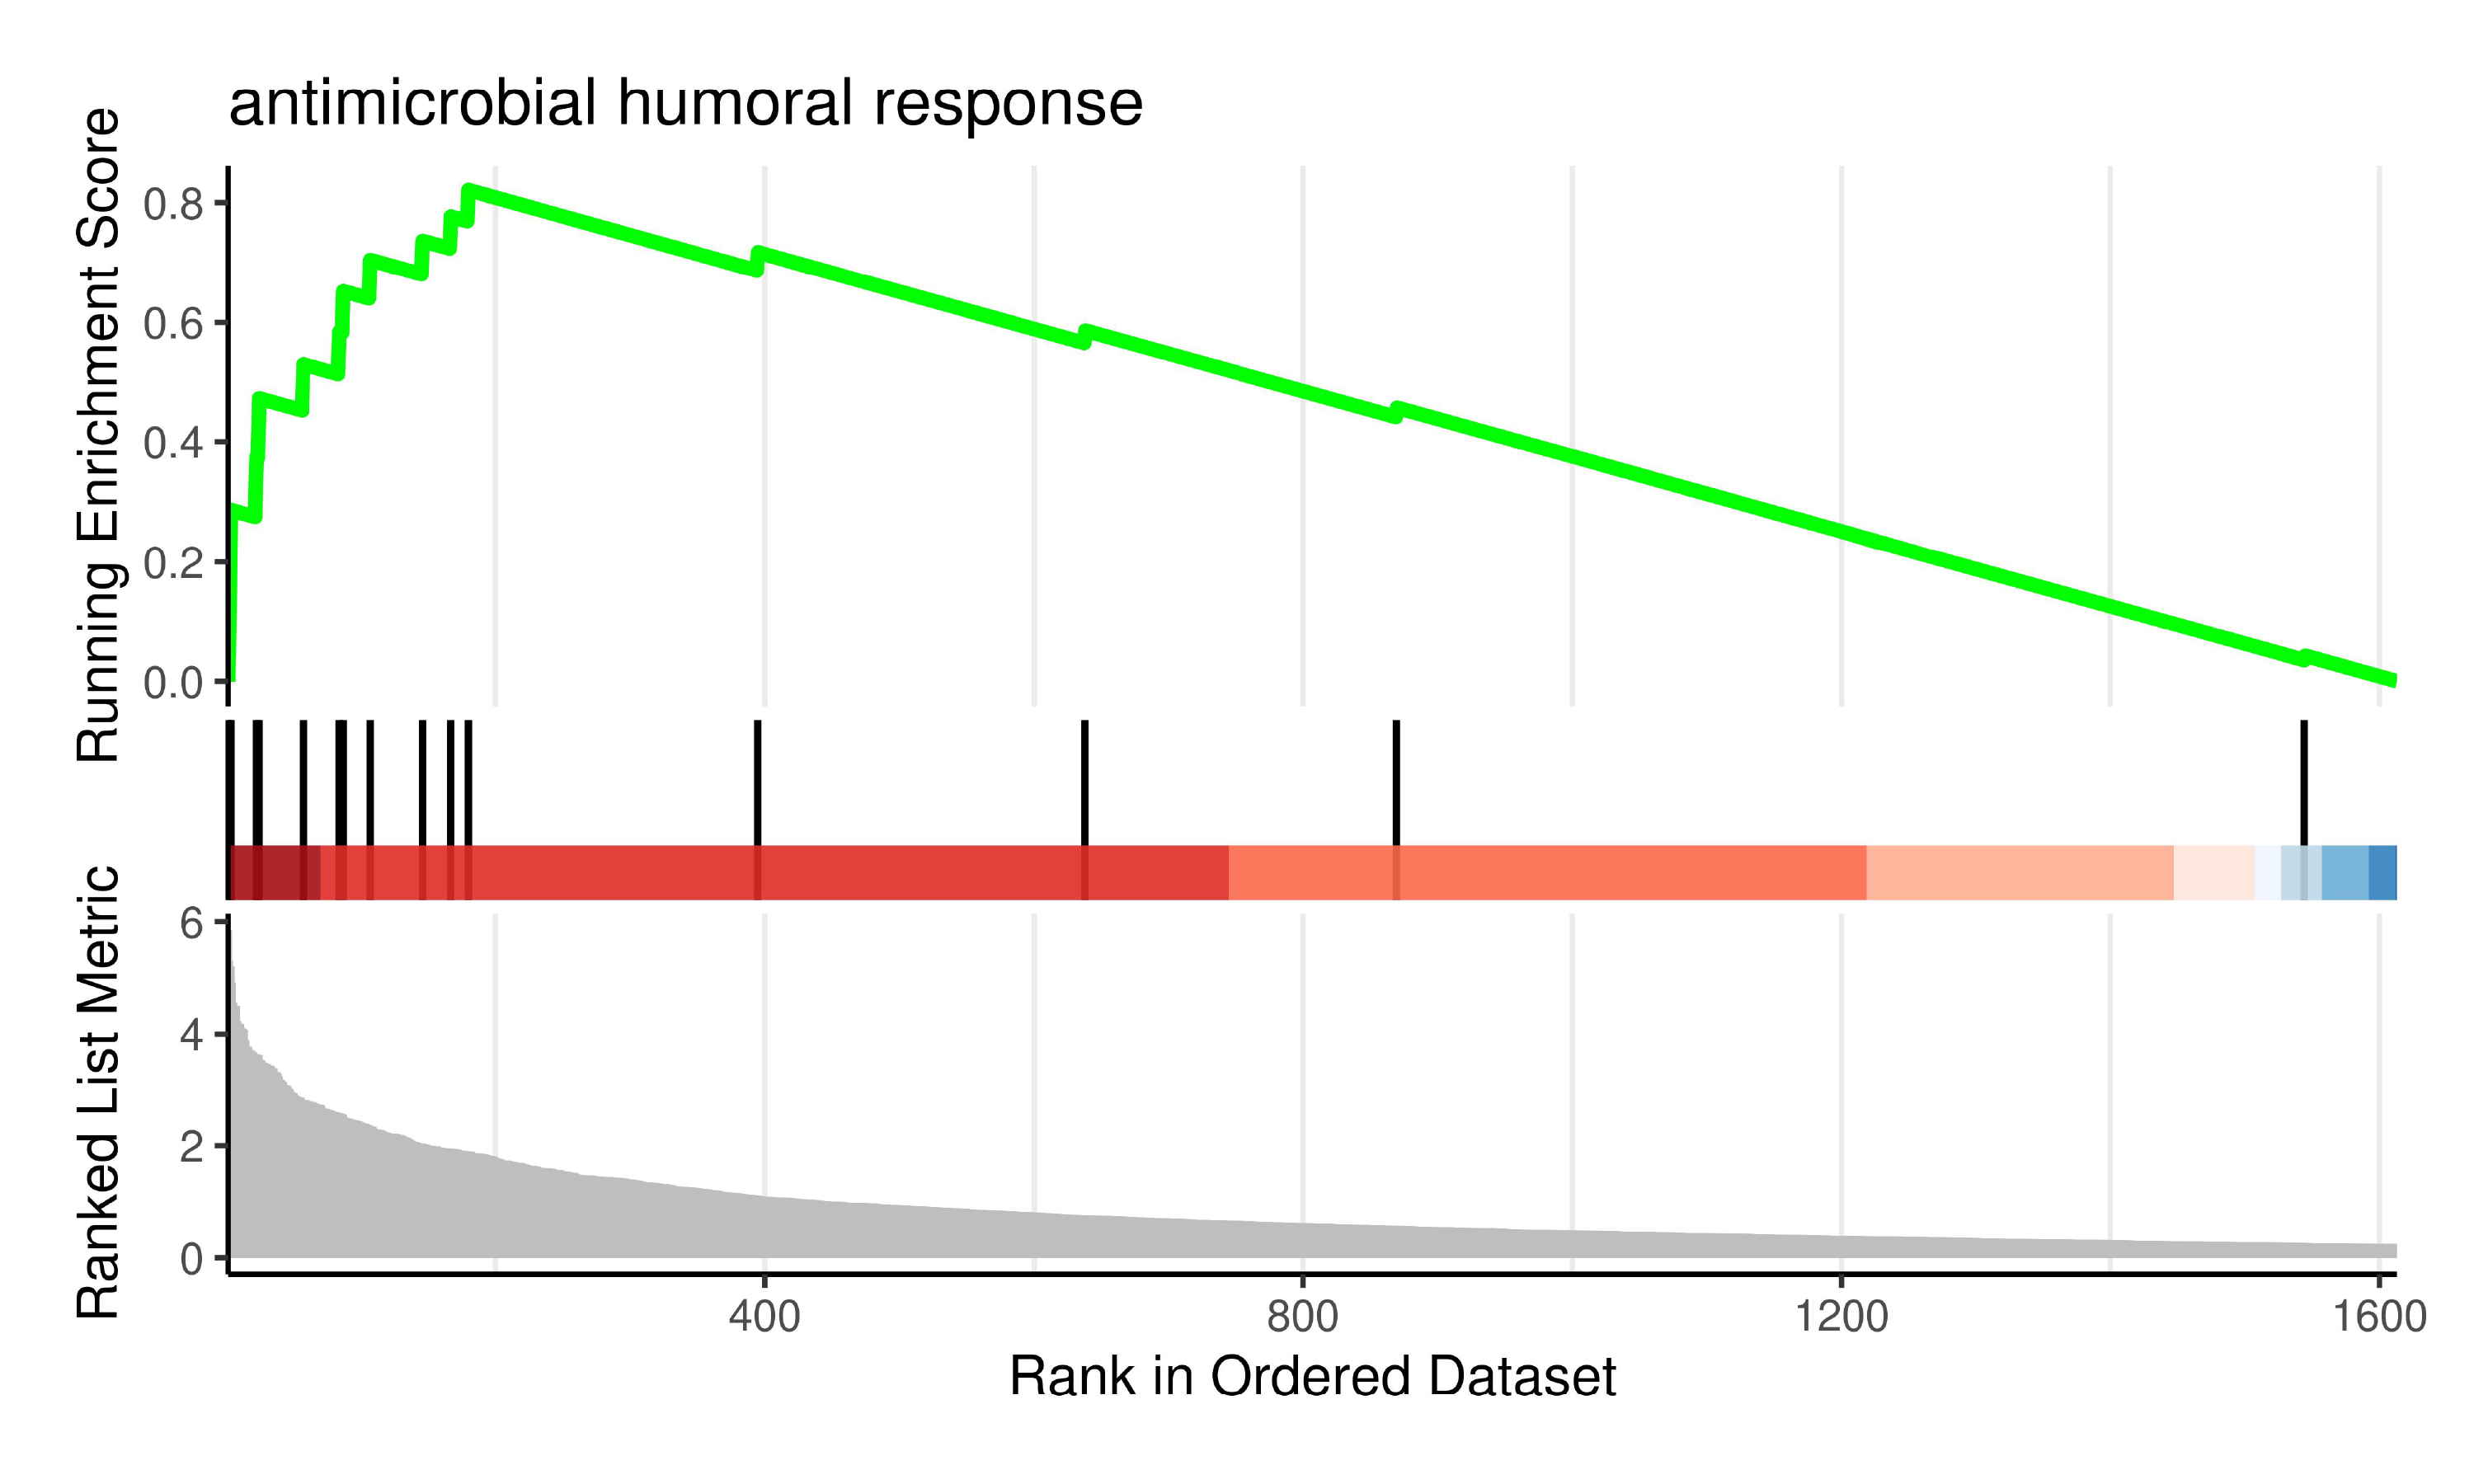
GSEA
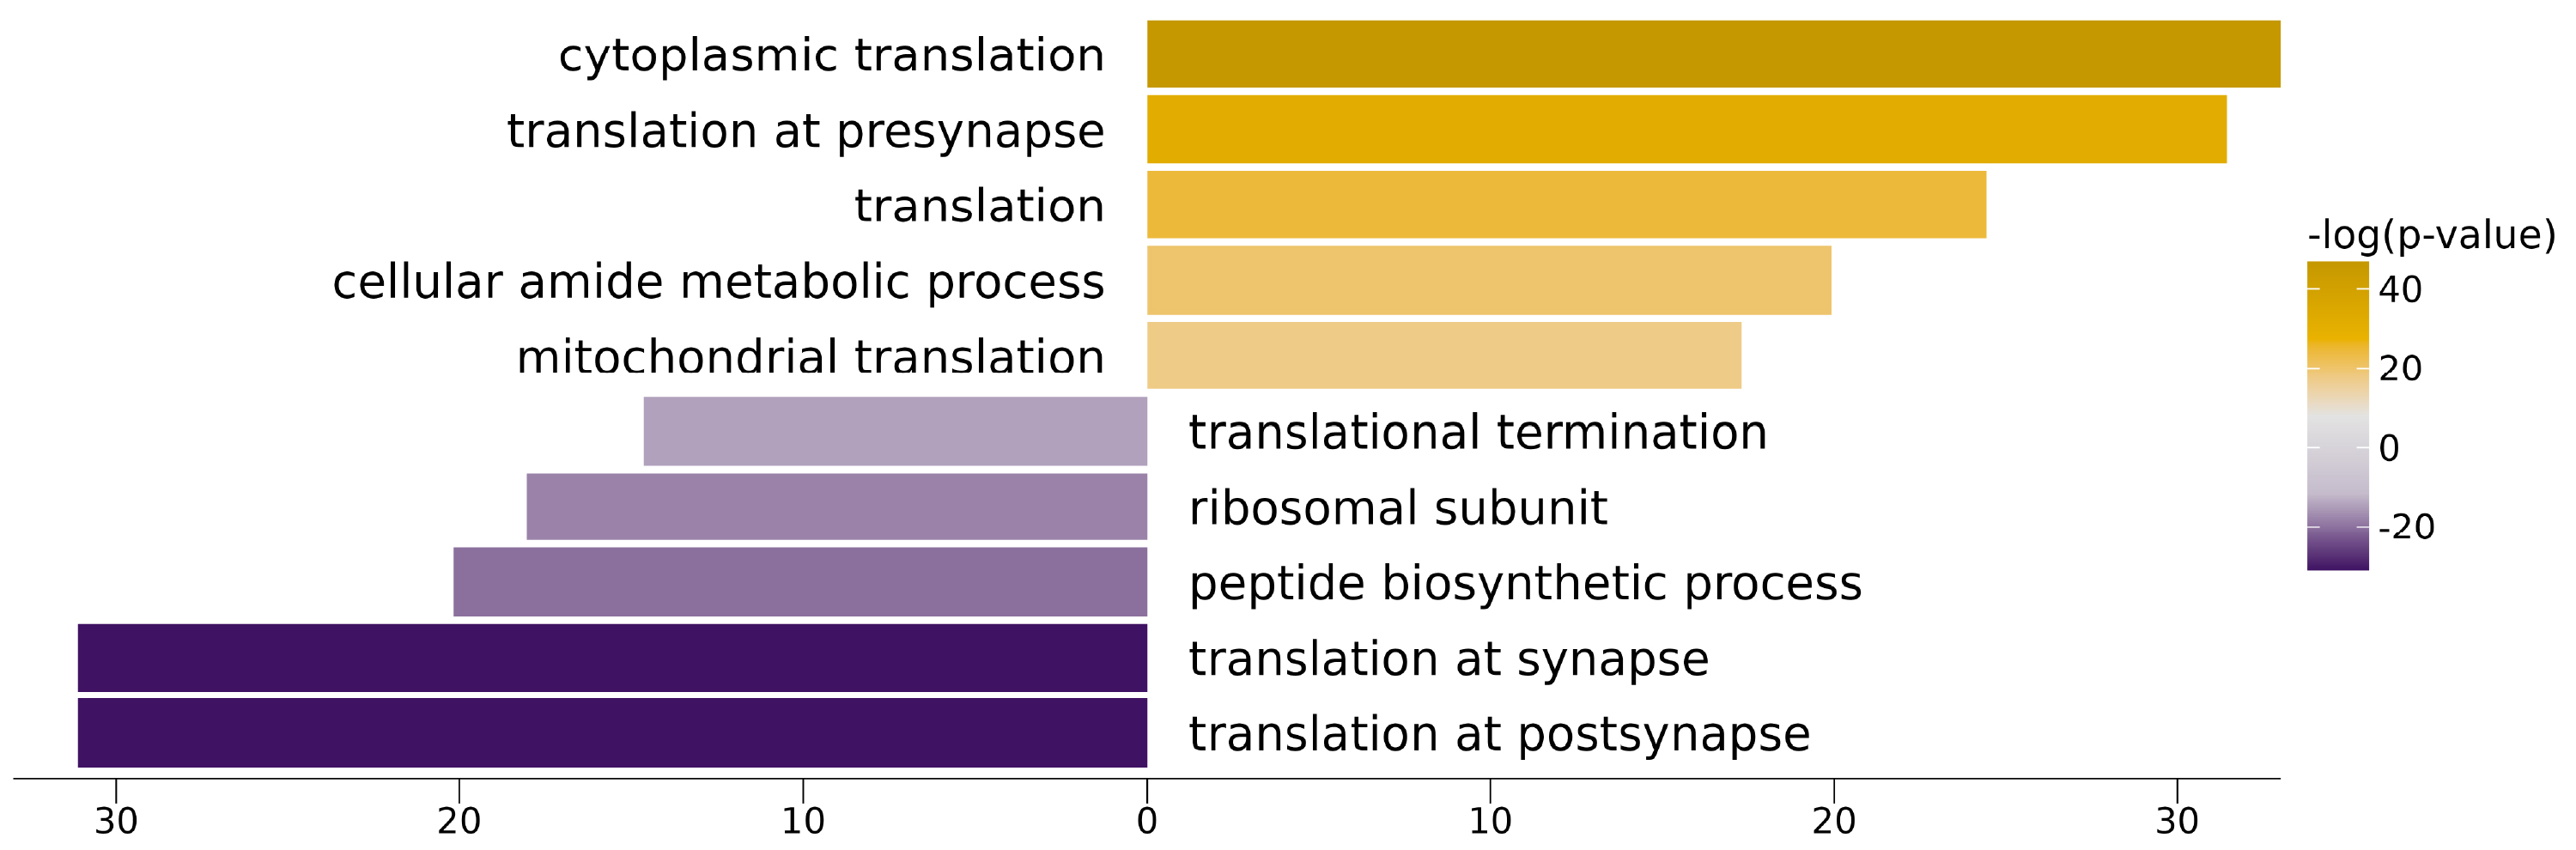
GO diverging bar plot
Pathway analysis (Pathveiw)
